1. Dot plots
To build dot plots diagrams, python uses a .txt file and a .tex template.
The python file to make dot plots is below.
The required LaTeX files are below.
The custom python modules required are:
A sample text file is below:
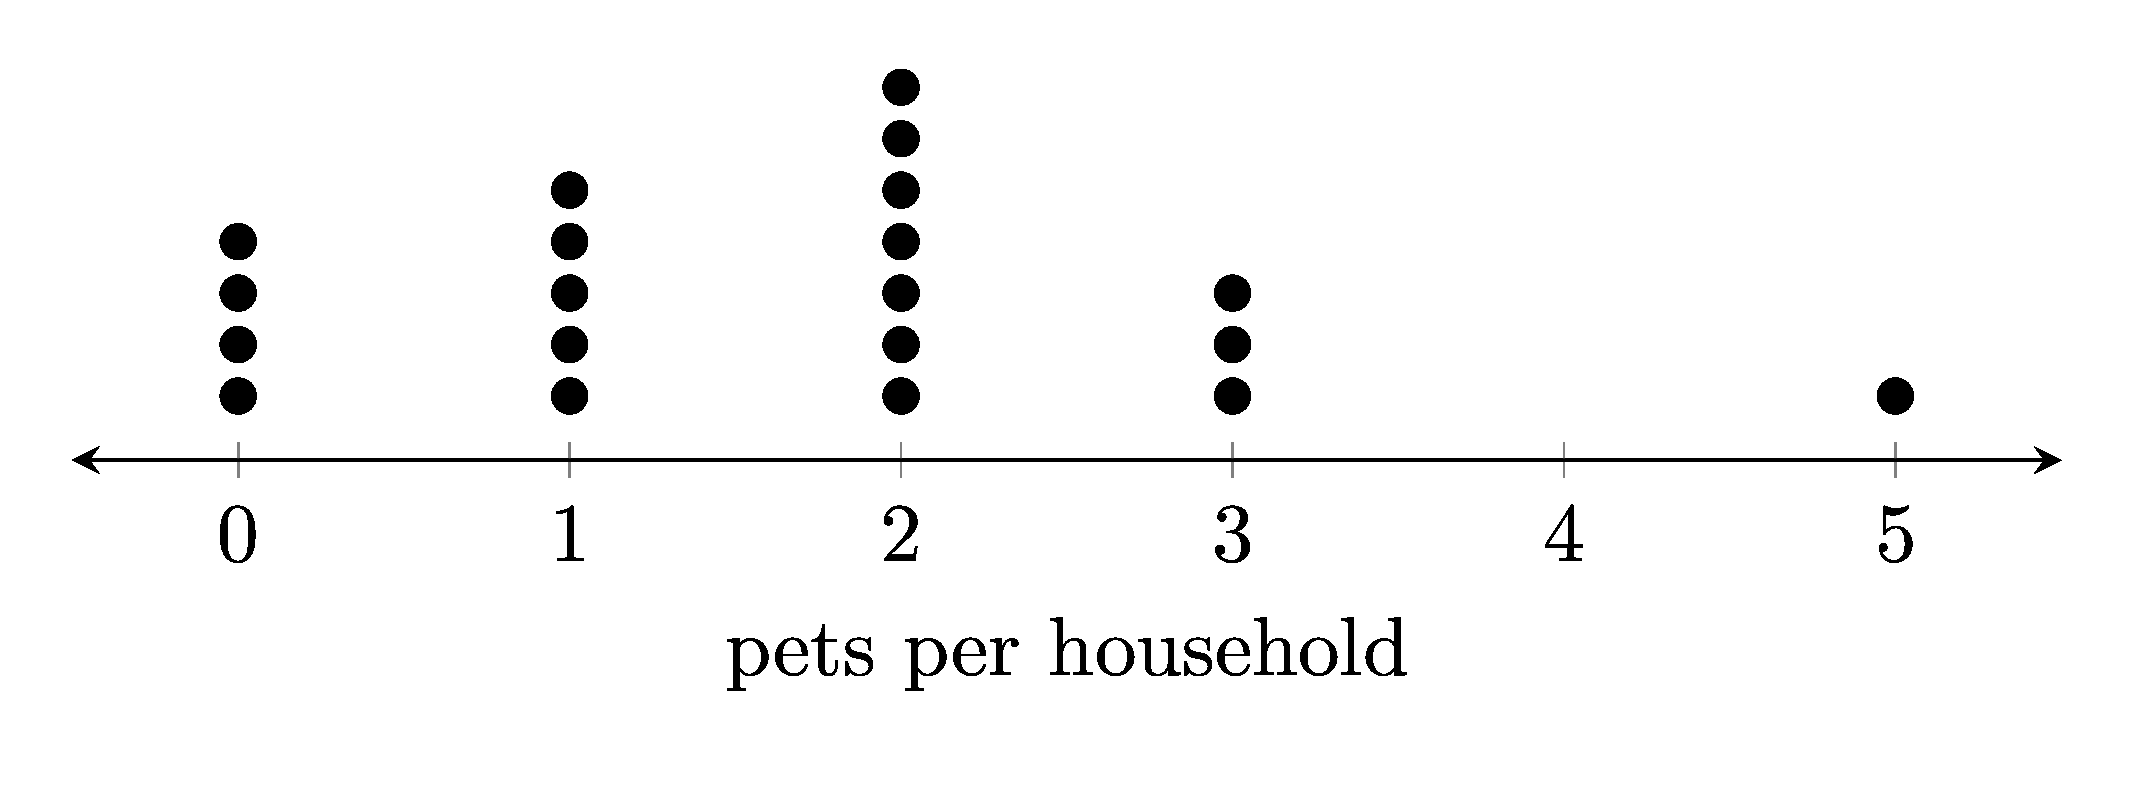
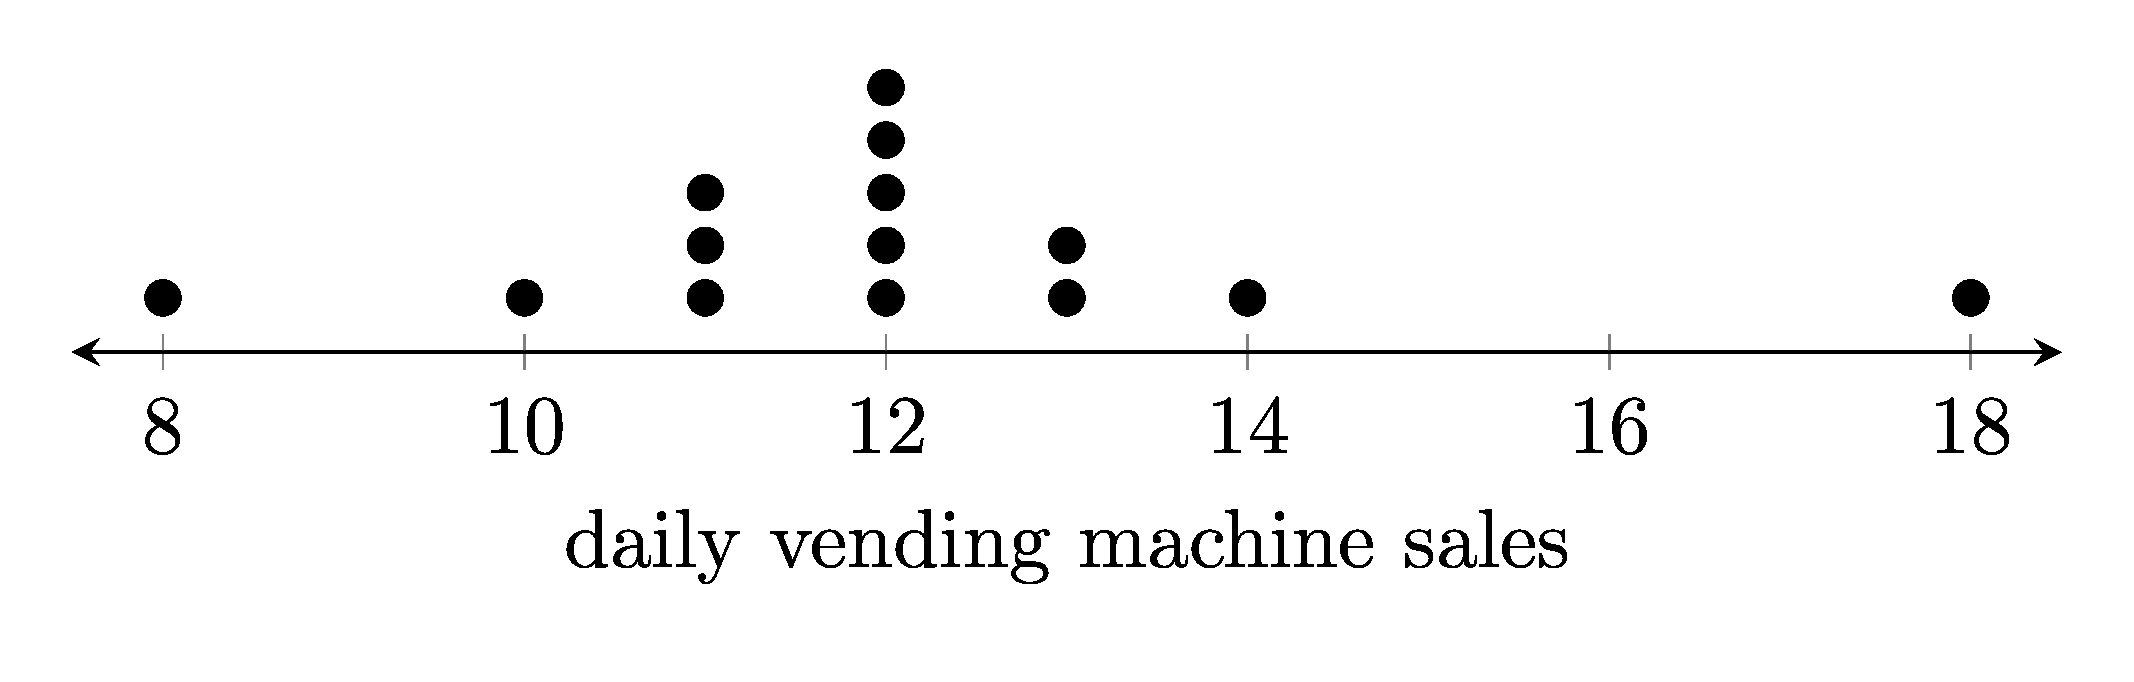
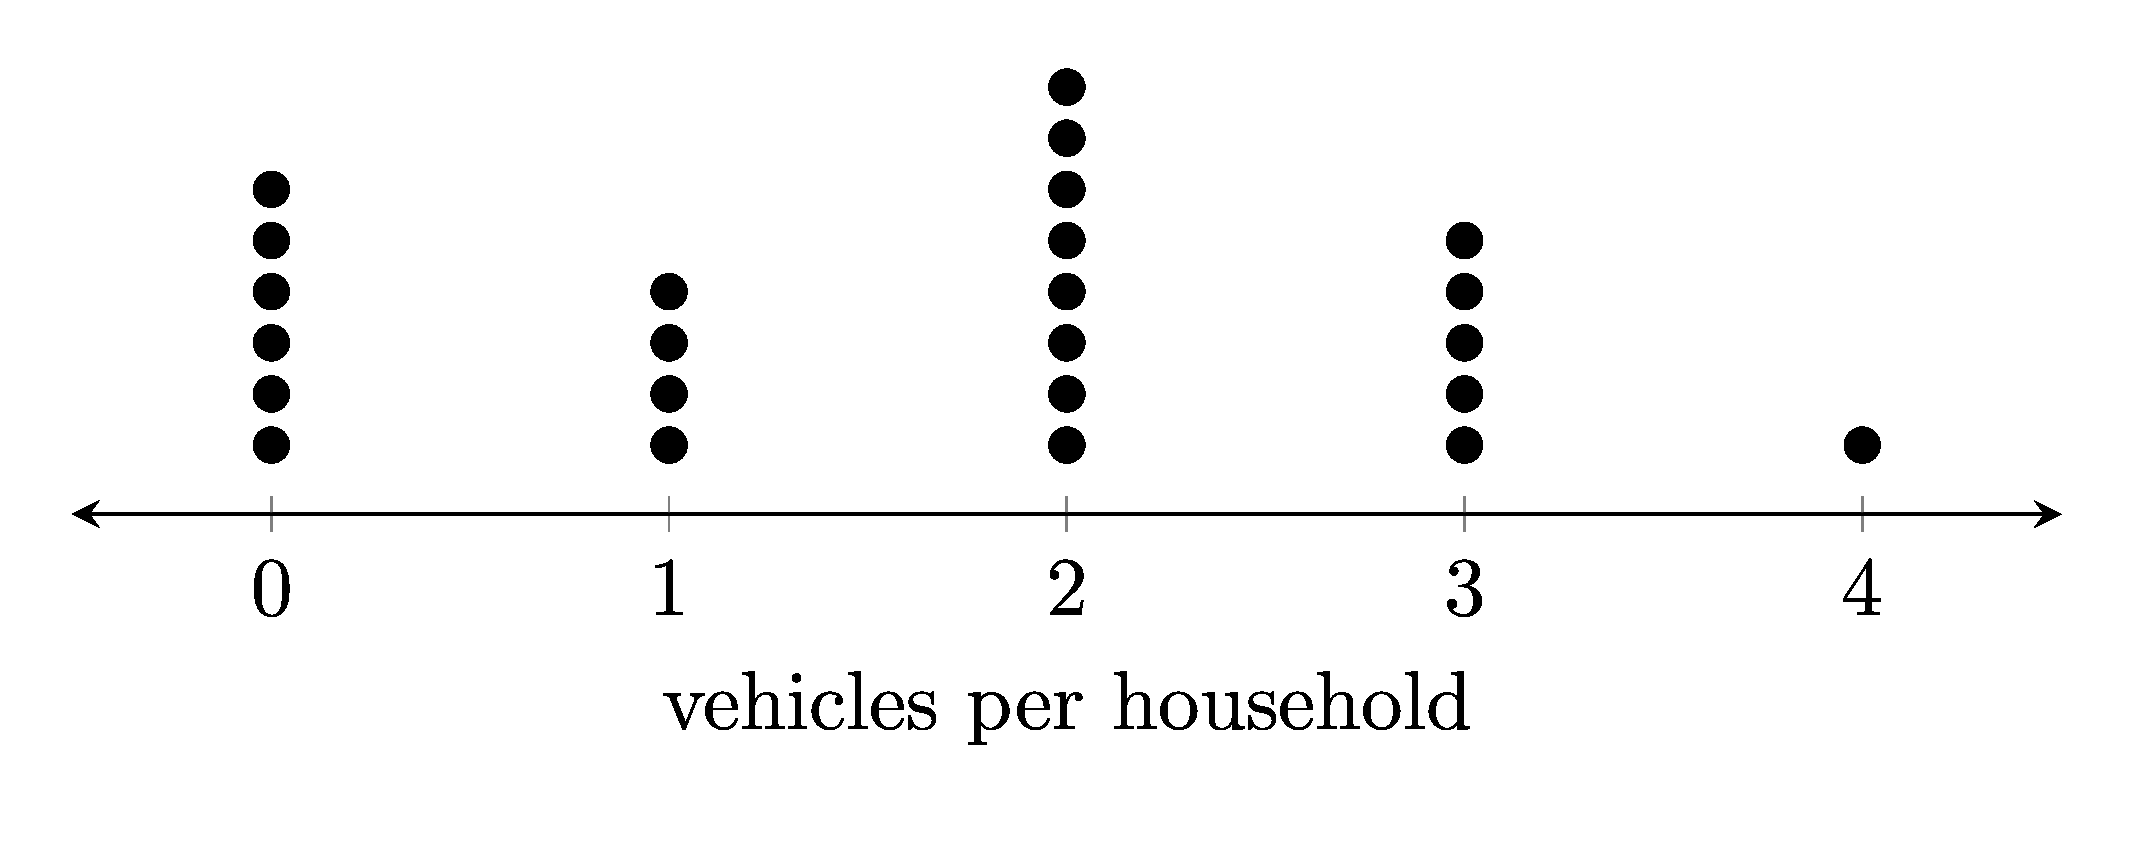
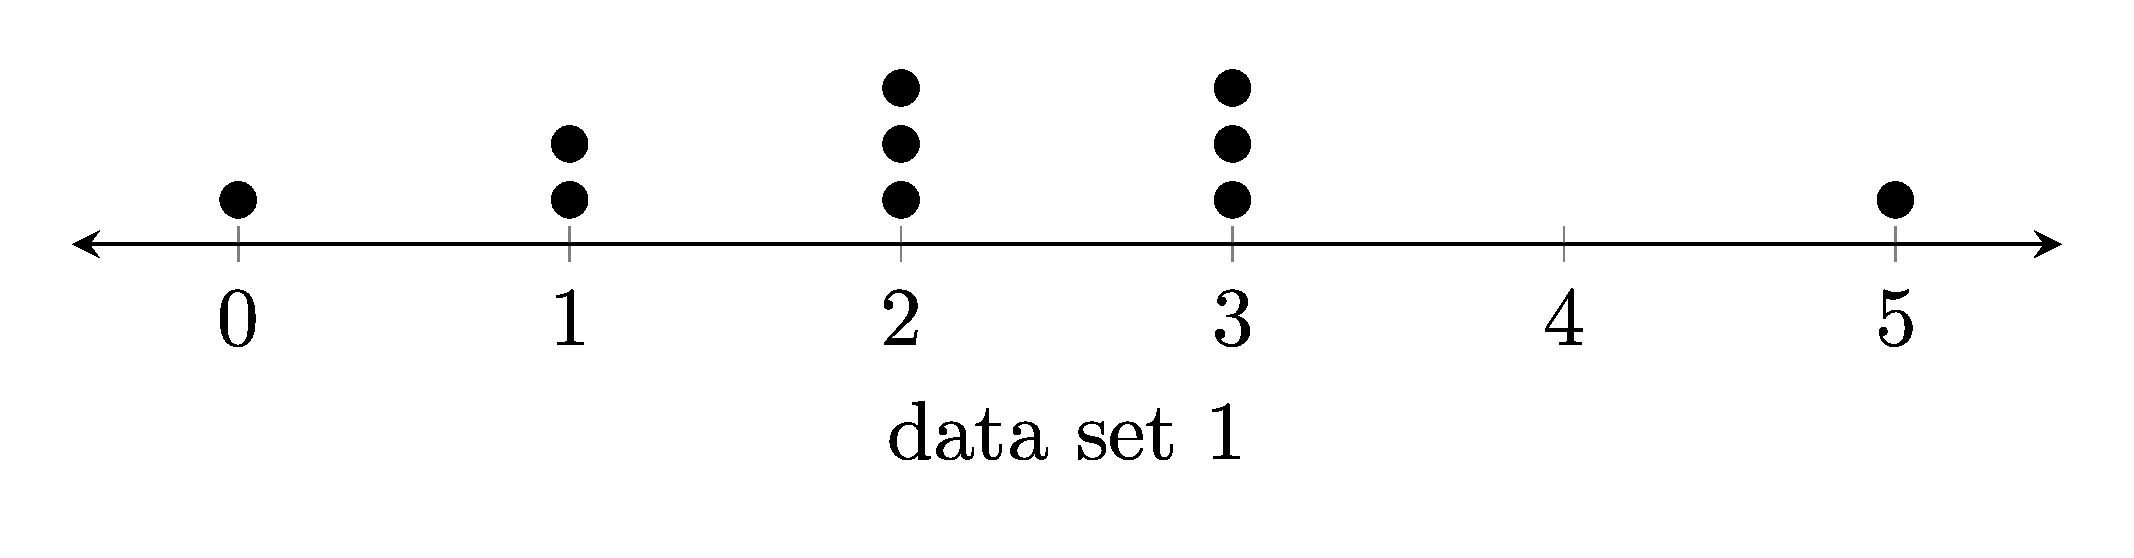
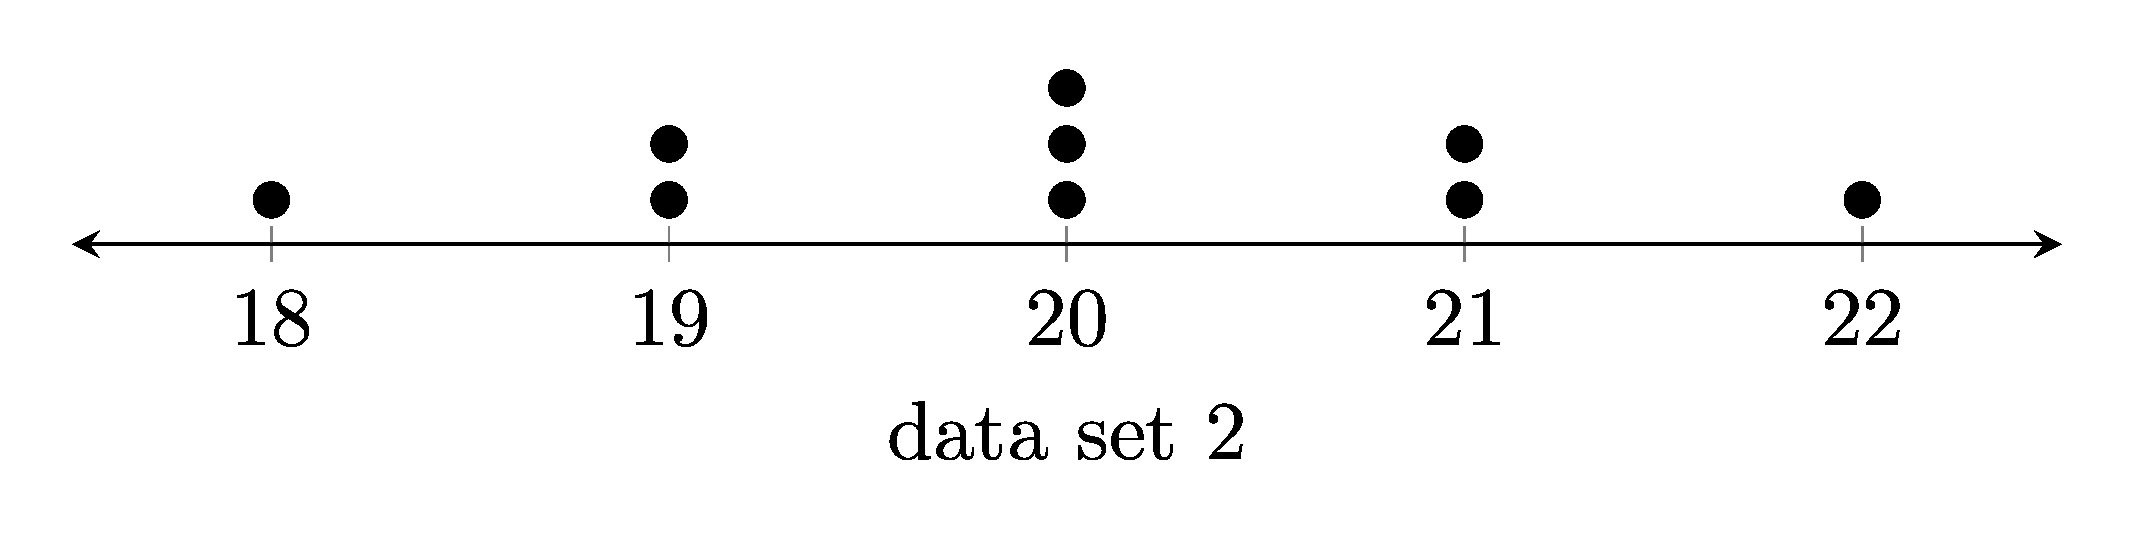
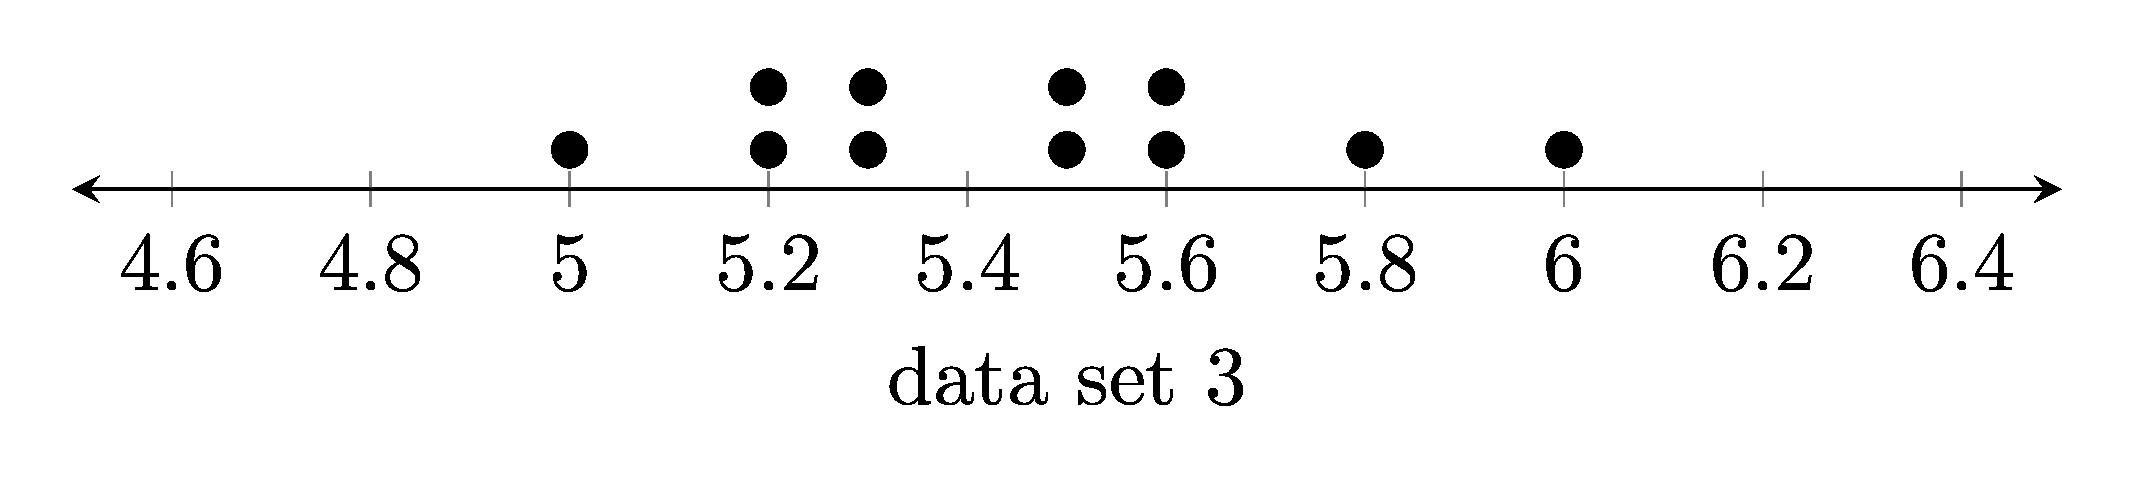
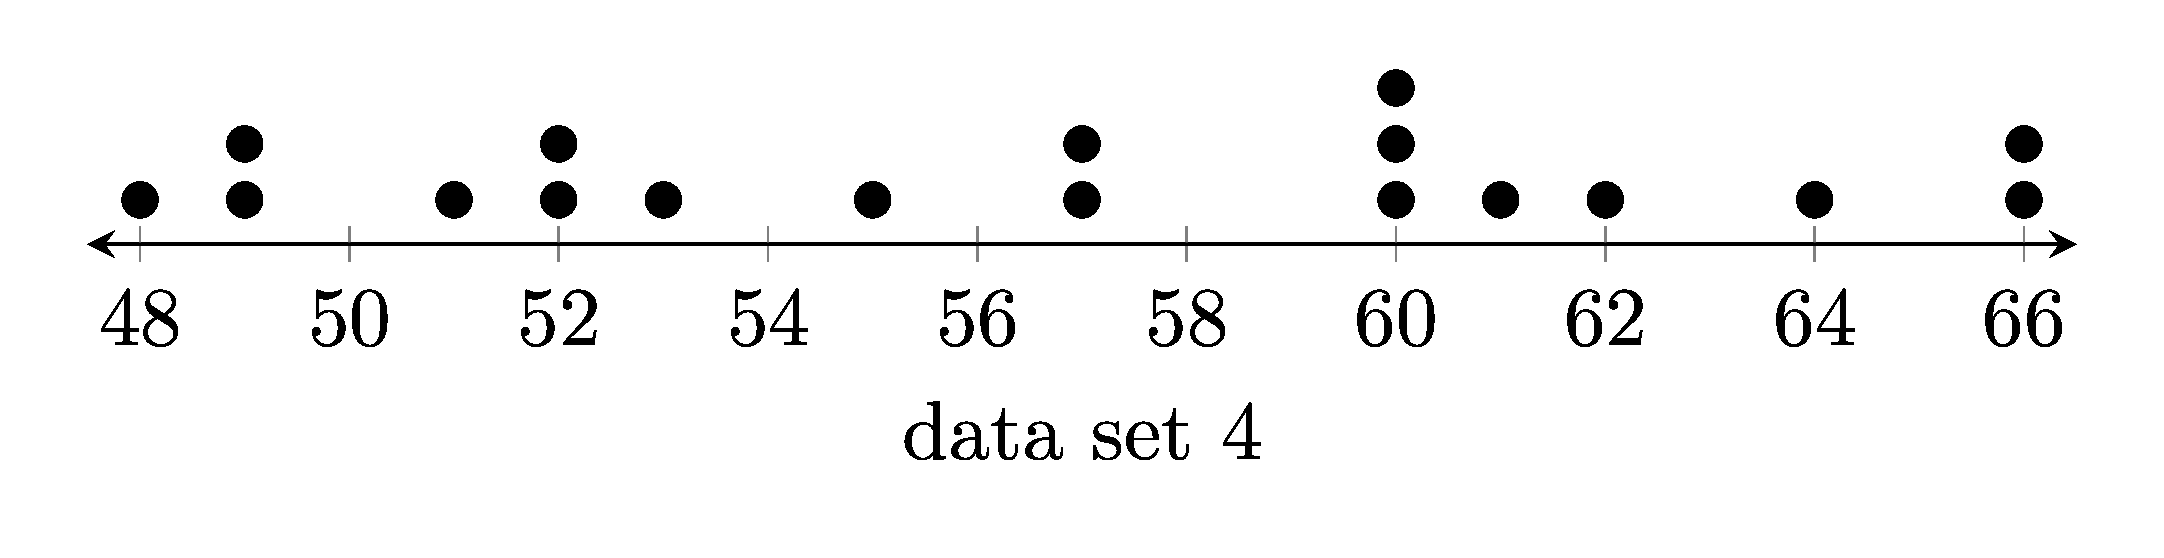
1.1. Example dot plots


1.2. LaTeX
The .tex file template is shown below.
\documentclass[border = 3mmm]{standalone}
\usepackage{pgfplots}
\pgfplotsset{width=10cm,height=<<height>>cm,compat=newest}
\begin{document}
\begin{tikzpicture}
\begin{axis}[
xmin=<<min_val>>,
xmax=<<max_val>>,
% hide y axis,
axis y line=none,
axis x line=bottom,
axis x line shift={4pt},
every outer x axis line/.append style={stealth-stealth},
title={},
xlabel={<<xlabel>>}]
\addplot [only marks, black, mark=*, mark size=2pt] coordinates{<<coords>>};
\end{axis}
\end{tikzpicture}
\end{document}
\documentclass[border = 3mmm]{standalone} specifies the document class as standalone and sets the border around the plot to 3mm.\usepackage{pgfplots} imports the pgfplots package, which is used to create the plot.\pgfplotsset{width=10cm,height=5cm,compat=newest} sets the width and height of the plot and the compatibility mode.\begin{document} marks the beginning of the document content.\begin{tikzpicture} marks the beginning of a tikzpicture environment, which is used to create the plot.\begin{axis}[...] marks the beginning of an axis environment, which defines the plot area. The options within the square brackets set hiding the y-axis and setting the x-axis to be displayed at the bottom.xmin=<<min_val>> sets the minimum value of the x axis, which comes for python.xmax=<<max_val>> sets the maximum value of the x axis, which comes for python.axis y line=none hides the y axis lineaxis x line=bottom draws the x axis line only at the bottomaxis x line shift={4pt} shifts the x axis down 4 points.every outer x axis line/.append style={stealth-stealth} adds arrow heads at both ends of the x axis linetitle={}, sets the title of the plot to be emptyxlabel={<<xlabel>>}] sets the label of the x axis to be <<xlabel>>, which comes for python.\addplot [only marks, black, mark=*, mark size=2pt] coordinates{<<coords>>}; adds a plot to the axis using only marker points using black marks of size 2pt. The coordinates come from python.\end{axis}, \end{tikzpicture}, and \end{document}: These mark the end of their respective environments.1.3. Txt file
The .txt file is shown below.
2 lines store data:
line 1: the dot plot label
line 2: a comma space separated list of numbers
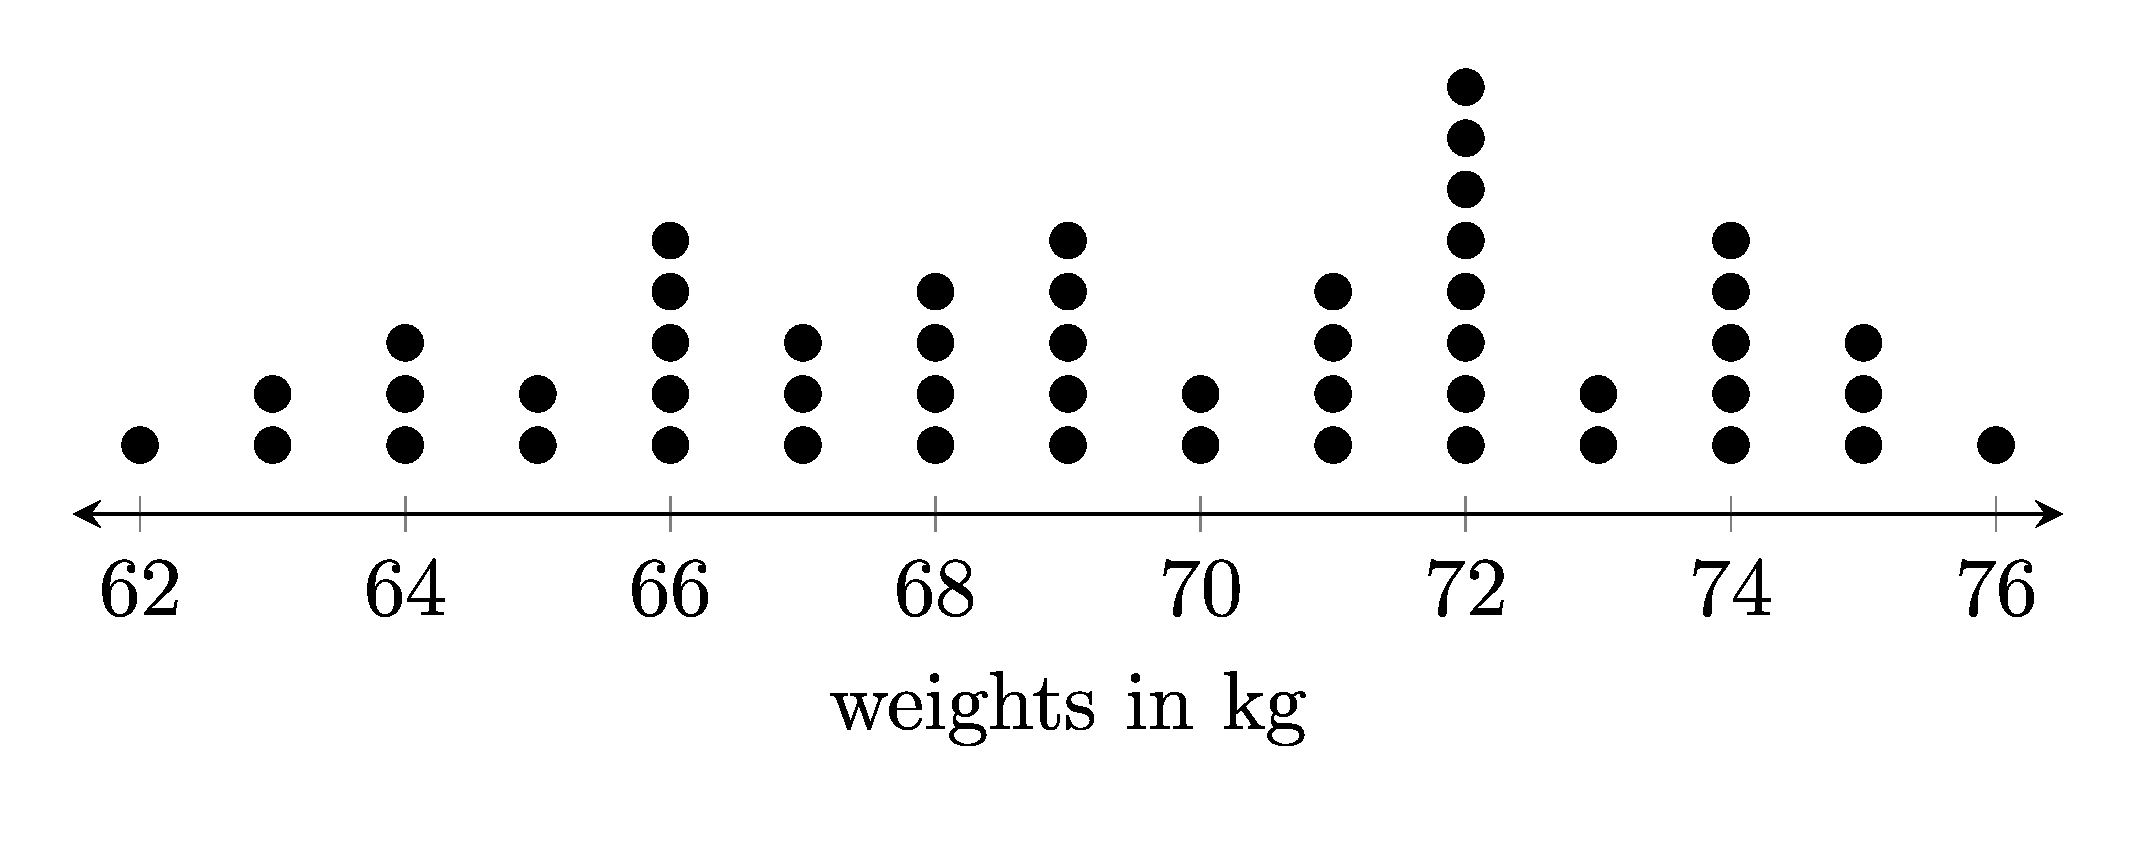
weights in kg
71, 67, 64, 72, 65, 69, 66, 68, 69, 72, 69, 73, 69, 72, 73, 74, 76, 68, 66, 63, 67, 71, 72, 74, 68, 69, 75, 71, 72, 72, 65, 66, 72, 74, 66, 62, 75, 75, 64, 63, 64, 66, 74, 67, 72, 70, 71, 70, 74, 68
1.4. Png file
The .png file is shown below.

1.5. Python code
The python code is shown below.
import numpy as np
from pathlib import Path
import subprocess
import os
from tkinter import filedialog
import time
import magick_pdf_to_png

currfile_dir = Path(__file__).parent
tex_template_path = currfile_dir / "dot_plot_template.tex"


def convert_to_pdf(tex_path, outputdir):
    tex_path = Path(tex_path).resolve()
    outputdir = Path(outputdir).resolve()
    # for testing
    # print(f"tex_path: {tex_path}")
    # print(f"outputdir: {outputdir}")
    try:
        # Generate the PDF
        subprocess.run(["latexmk", "-pdf", "-outdir=" + str(outputdir), str(tex_path)], check=True, stdout=subprocess.DEVNULL, stderr=subprocess.DEVNULL)
        # # Clean auxiliary files after successful PDF generation
        subprocess.run(["latexmk", "-c", "-outdir=" + str(outputdir), str(tex_path)], check=True, stdout=subprocess.DEVNULL, stderr=subprocess.DEVNULL)
        # for hosted remove stdout=subprocess.DEVNULL, stderr=subprocess.DEVNULL for debugging any errors
        # Remove the .tex file manually
        if tex_path.exists():
            os.remove(tex_path)
    except subprocess.CalledProcessError as e:
        print(f"Error: {e}")


def get_np_array(filename):
    # open the text file and read the numbers
    with open(filename) as f:
        # read the first line and store it in a variable
        plot_xlabel = f.readline().strip()
        # read the second line and store it in a variable
        numbers_string = f.readline().strip()
        if ", " in numbers_string:
            numbers = numbers_string.split(", ")
        elif "," in numbers_string:
            numbers = numbers_string.split(",")
        else:
            numbers = numbers_string.split(" ")

    # convert the numbers strings to integers
    if "." in numbers_string:
        numbers = [float(n) for n in numbers]
    else:
        numbers = [int(n) for n in numbers]
    # create a numpy array from the numbers
    return plot_xlabel, np.array(numbers)


def dotplot(input_x):
    # get 2 arrays in order with counts for each value
    unique_values, counts = np.unique(input_x, return_counts=True)
    # get max counts for pdf height
    max_counts = np.max(counts)
    # # Convert into coordinates space delimited for latex
    coords = ""
    for idx, value in enumerate(unique_values):
        for counter in range(1, counts[idx] + 1):
            coord = (value, counter)
            coords += str(coord)
    return coords, max_counts


def main():
    data_filename = filedialog.askopenfilename(initialdir=Path(currfile_dir))
    if data_filename == "":
        print("Exited, by clicking Cancel")
        return
    plot_xlabel, num_array = get_np_array(data_filename)
    latex_coords, max_counts = dotplot(num_array)
    pdf_height = str(min(8, 1.4 + max_counts / 4))
    # print(pdf_height)
    # Get the maximum value
    max_val = str(np.max(num_array) + 0.5)
    # Get the minimum value
    min_val = str(np.min(num_array) - 0.5)

    # Create a Path object from the file path
    path_obj = Path(data_filename)

    # Get the file name from the Path object using the name attribute
    filename = path_obj.stem
    # filename = input("Enter the base filename to be added to the prefix dp_: \n")
    # if not filename:
    #     filename = "dp_1"
    # set names of files that are made
    tex_output_path = currfile_dir / f"{filename}.tex"
    pdf_path = currfile_dir / f"{filename}.pdf"
    png_path = currfile_dir / f"{filename}.png"

    # Read in the LaTeX template file
    with open(tex_template_path, "r") as infile:
        tex_template_txt = infile.read()

    # Replace the placeholders in the LaTeX template
    tex_template_txt = tex_template_txt.replace("<<coords>>", latex_coords)
    tex_template_txt = tex_template_txt.replace("<<xlabel>>", plot_xlabel)
    tex_template_txt = tex_template_txt.replace("<<max_val>>", max_val)
    tex_template_txt = tex_template_txt.replace("<<min_val>>", min_val)
    tex_template_txt = tex_template_txt.replace("<<height>>", pdf_height)

    # Write the question tex to an output file
    with open(tex_output_path, "w") as outfile:
        outfile.write(tex_template_txt)

    # Wait for the files to be created
    time.sleep(1)
    # Convert the LaTeX files to PDFs
    convert_to_pdf(tex_output_path, currfile_dir)

    # Wait for the files to be created
    time.sleep(1)
    # Convert the PDFs to PNGs
    magick_pdf_to_png.convert_pdf_to_png(pdf_path, png_path)


if __name__ == "__main__":
    print("starting")
    main()
    print("finished")