1. Graph paper
Some simple graph papers are below with some explanations of the code.
The document class used for a cropped picture is standalone.


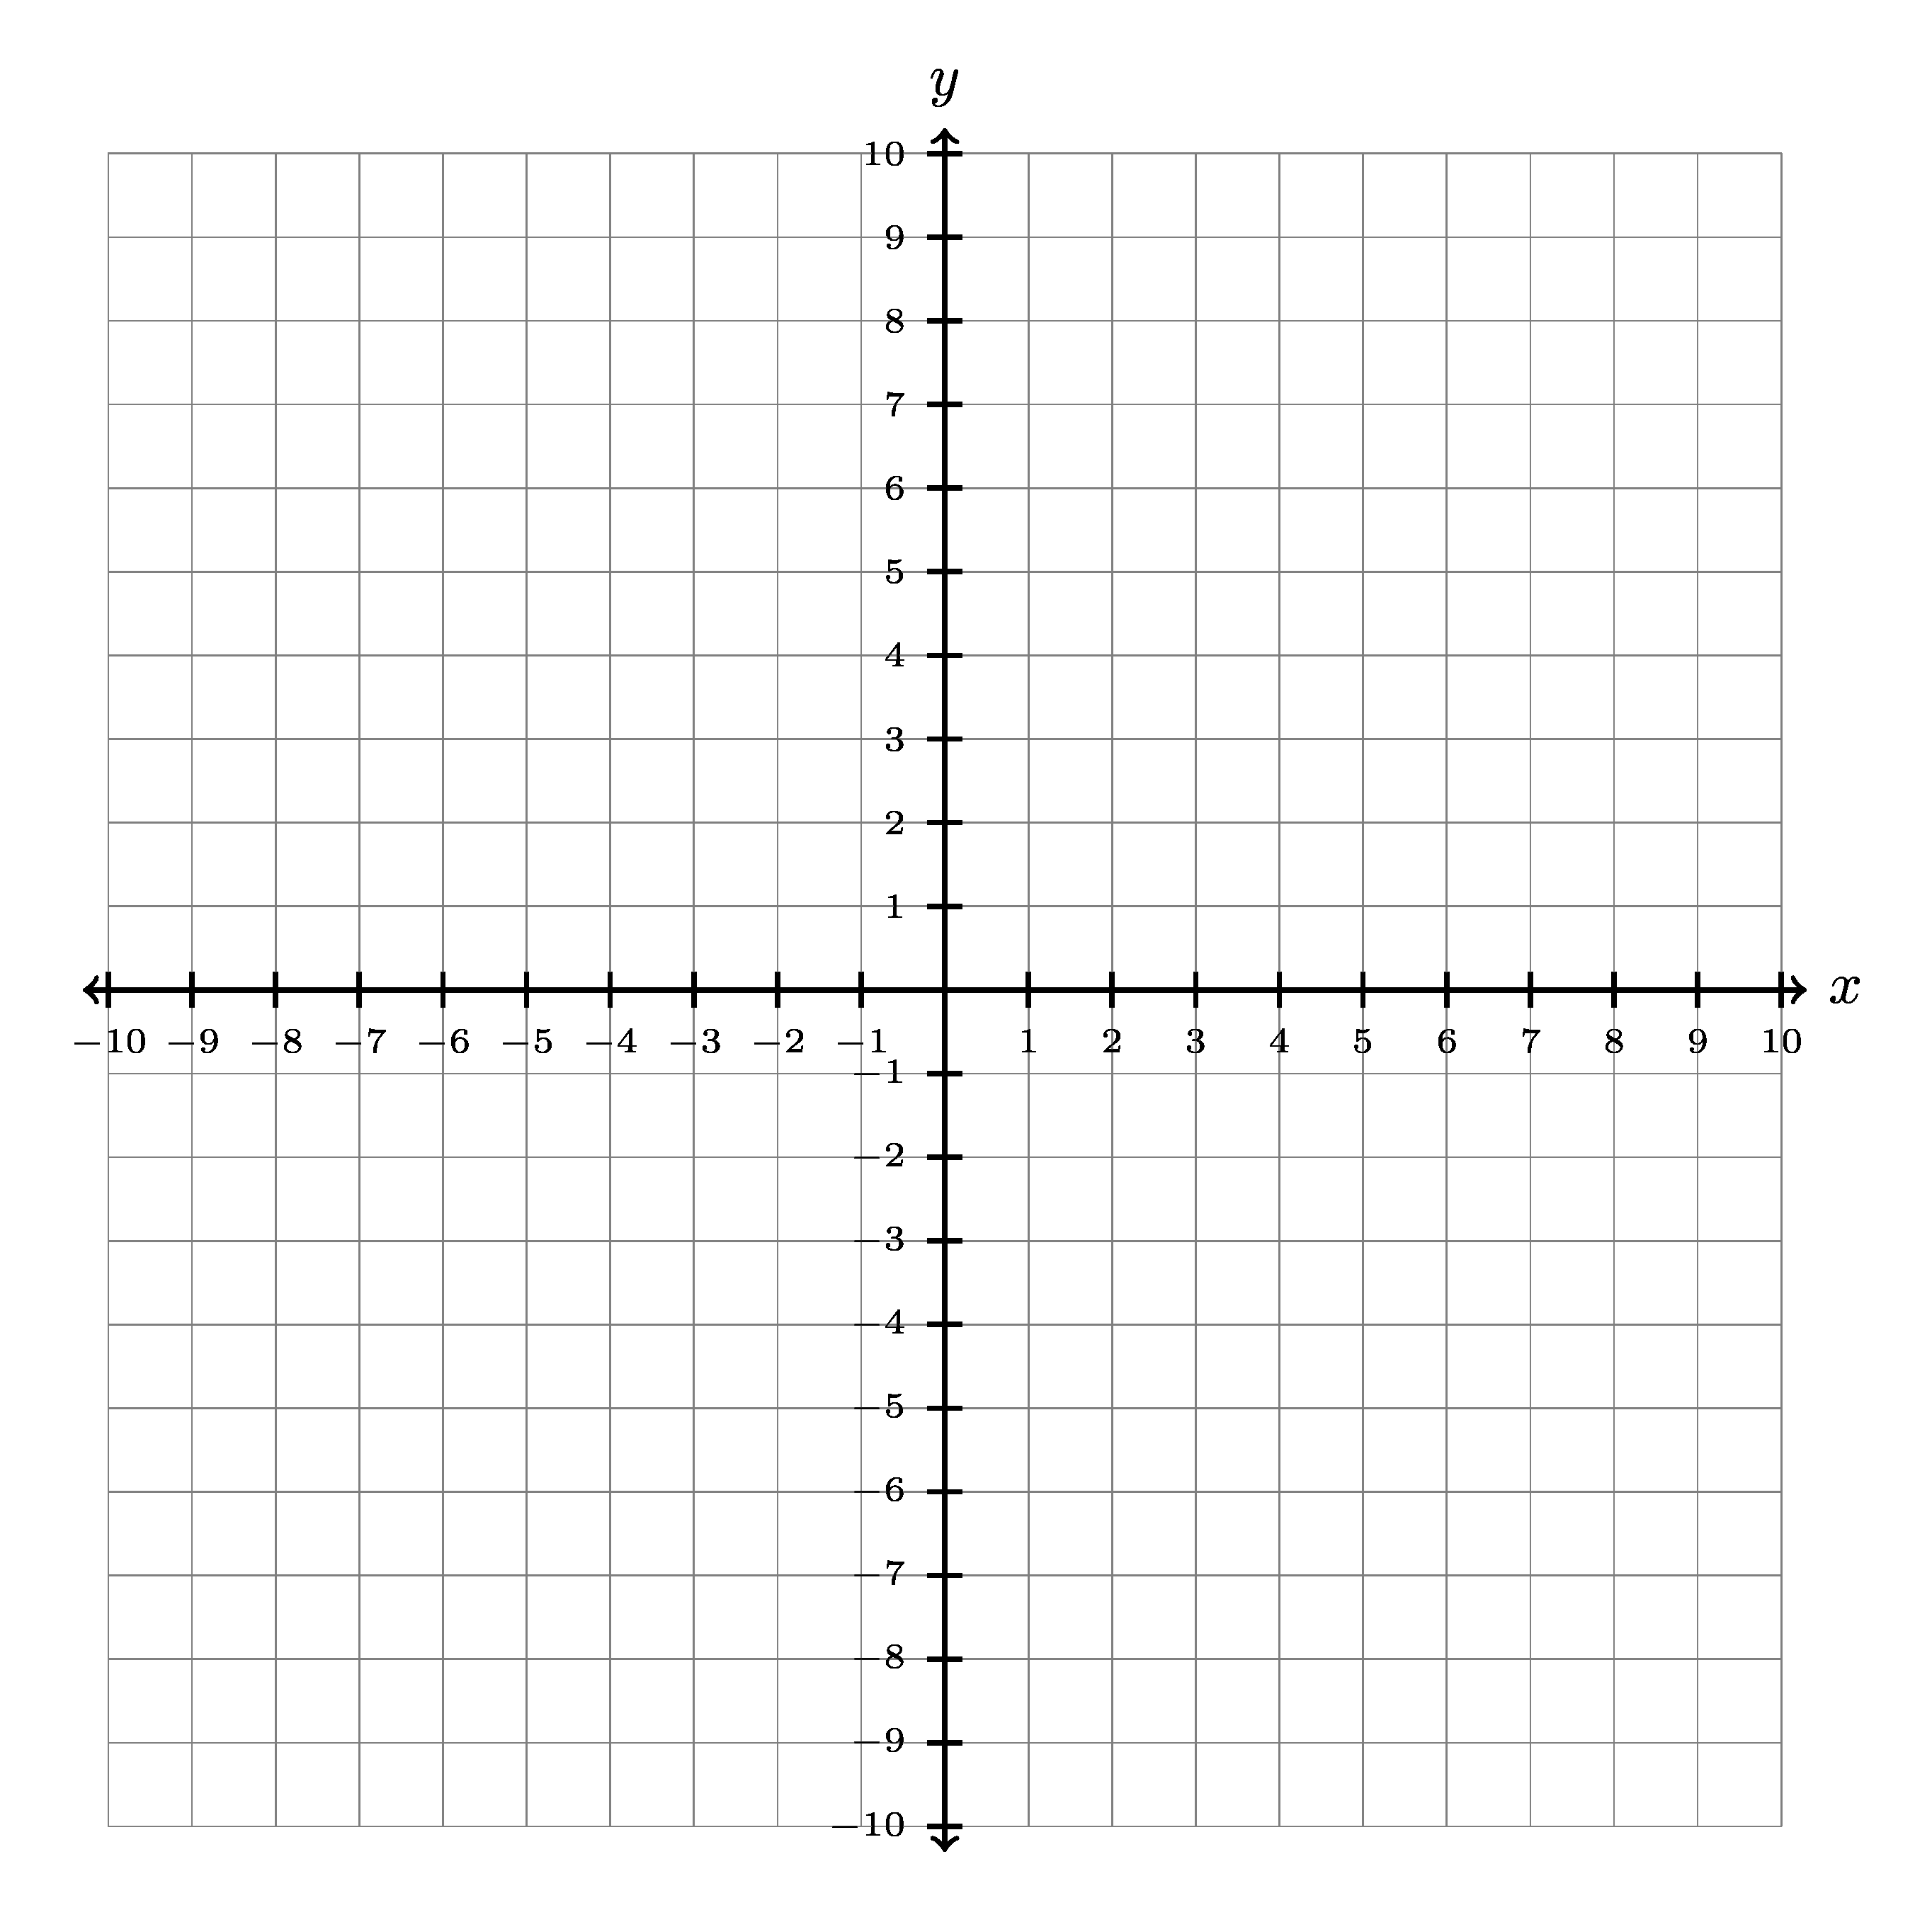
1.1. 10 by 10 graph with ticks every 2
The 10 by 10 graph, with axes labelled is below.
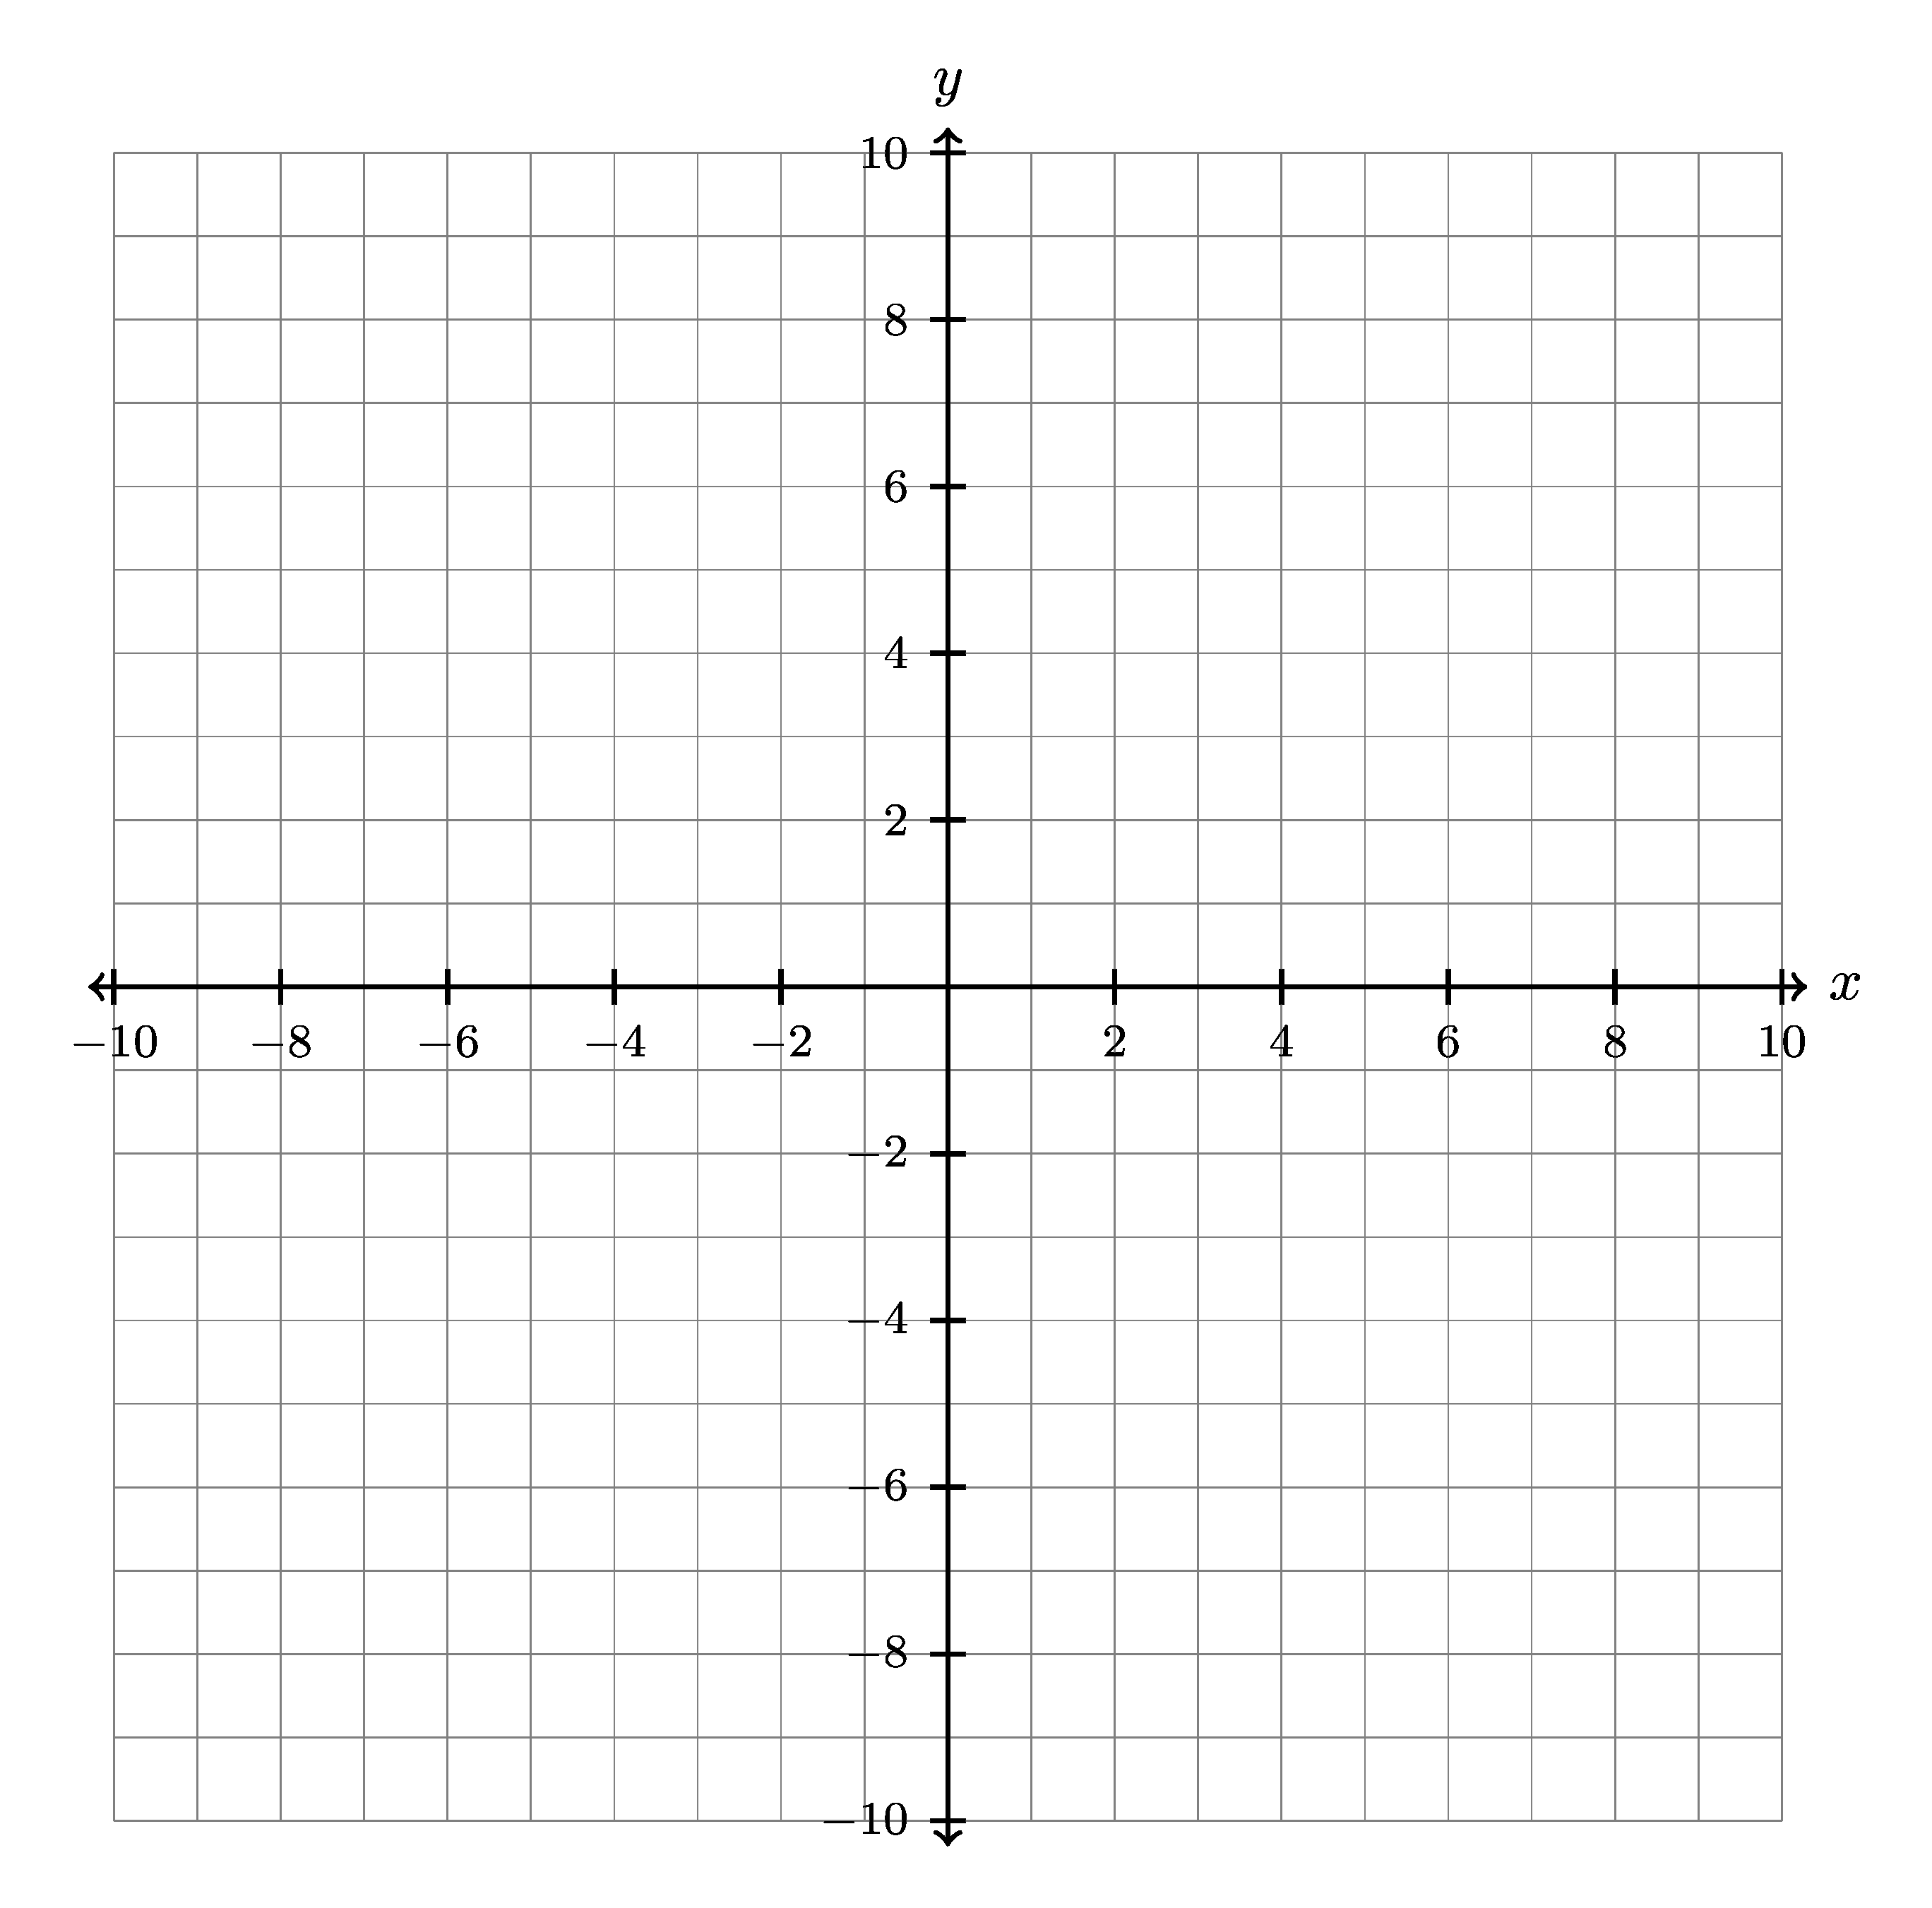
The LaTeX for the graph is below.
\documentclass[border = 3mm]{standalone}
\usepackage{tikz}

\begin{document}
\begin{tikzpicture}
  % grid black help lines default colour is black!40
  \draw[help lines, black!20, step = 0.5cm] (-5, -5) grid (5, 5);

  % axis with end labels
  \draw[thick, <->] (0, -5.15) -- (0, 5.15) node[above] {$y$};
  \draw[thick, <->] (-5.15, 0) -- (5.15, 0) node[right] {$x$};

  % numbers along each axis .
  \foreach \x in {-10,-8,...,-2,2,4,...,10}
    \draw [thick] (\x cm/2,3pt) -- (\x cm/2,-3pt) node[anchor=north] {\fontsize{8}{11}\selectfont$\x$};
  \foreach \y in {-10,-8,...,-2,2,4,...,10}
    \draw [thick] (3pt,\y cm/2) -- (-3pt,\y cm/2) node[anchor=east] {\fontsize{8}{11}
    \selectfont$\y$};

\end{tikzpicture}
\end{document}
1.1.1. Document class
The command
\documentclass[border = 3mm]{standalone} is used to create a standalone document that shrinks the page to just contain the contents with a 3mm border around it.1.1.2. Help lines
The command
\draw[help lines, step = 0.5cm] (-5, -5) grid (5, 5) is used to draw a grid of horizontal and vertical lines that are spaced 0.5cm apart.The help lines option specifies that the lines should be thin and gray.
The
step = 0.5cm option specifies the distance between the lines.The coordinates
(-5, -5) and (5, 5) specify the lower-left and upper-right corners of the grid.1.1.3. Axes
The command
\draw[thick, <->] (0, -5.15) -- (0, 5.15) node[above] {$y$} is used to draw a vertical line that extends from -5.1 to 5.1 on the y-axis.The thick option specifies that the line should be drawn with a thick stroke.
The
<-> option specifies that arrowheads should be added to both ends of the line.The
(0, -5.15) and (0, 5.15) specify the starting and ending points of the line.The
node[above] {$y$} adds a label “y” above the line.The for loops draw ticks at every 2 units from -10 to 10.
The command
\foreach \x in {-10,-8,...,-2,2,4,...,10} is used to iterate over the list of numbers from -10 to 10 with a step of 2.The command
\draw [thick] (\x cm/2,3pt) -- (\x cm/2,-3pt) is used to draw a thick line at each tick mark from 3pt above to -3pt below the number line.Since the number line goes from -10 to +10 over 10 cm,
\x cm/2 is required to position the ticks correctly.The command
node[anchor=north] {\fontsize{8}{11}\selectfont$\x$} is used to label each tick mark with its corresponding number.