3. Parallel Overlay Dot plots
To build parallel overlay dot plots diagrams, with one diagram below the other, python uses a .txt file and a .tex template.
The python file to make parallel overlay dot plots is below.
The required LaTeX files are below.
The custom python modules required are:
A sample text file is below:
3.1. LaTeX
The .tex file template is shown below.
\documentclass[border = 3mmm]{standalone}
\usepackage{pgfplots}
\pgfplotsset{width=10cm,height=<<height>>cm,compat=newest}
\begin{document}
\begin{tikzpicture}
    \begin{axis}[
        % align left:
        legend style={
            cells={anchor=west},
            legend pos=outer north east,
            },
        xmin=<<min_val>>,
        xmax=<<max_val>>,
        % hide y axis,
        axis y line=none,
        axis x line=bottom,
        % set the precision of the x tick labels to be 0, which means no decimals
        % xticklabel style={/pgf/number format/precision=0},
        xtick={<<min_tval>>,...,<<max_tval>>},   %,<<min_tplus1>>
        axis x line shift={4pt},
        every outer x axis line/.append style={stealth-stealth},
        xlabel={<<xlabel>>}]
        \addplot [only marks, gray!40!, mark=*, mark size=3.5pt] coordinates{<<coords>>};
        \addplot [only marks, black, mark=*, mark size=1.2pt] coordinates{<<coords2>>};
        \legend{<<title>>, <<title2>>};
    \end{axis}
\end{tikzpicture}
\end{document}
3.2. Txt file
The .txt file is shown below.
5 lines store data:
line 1: the dot plot label
line 2: the first data label
line 3: a comma space separated list of numbers
line 4: the second data label
line 5: a comma space separated list of numbers
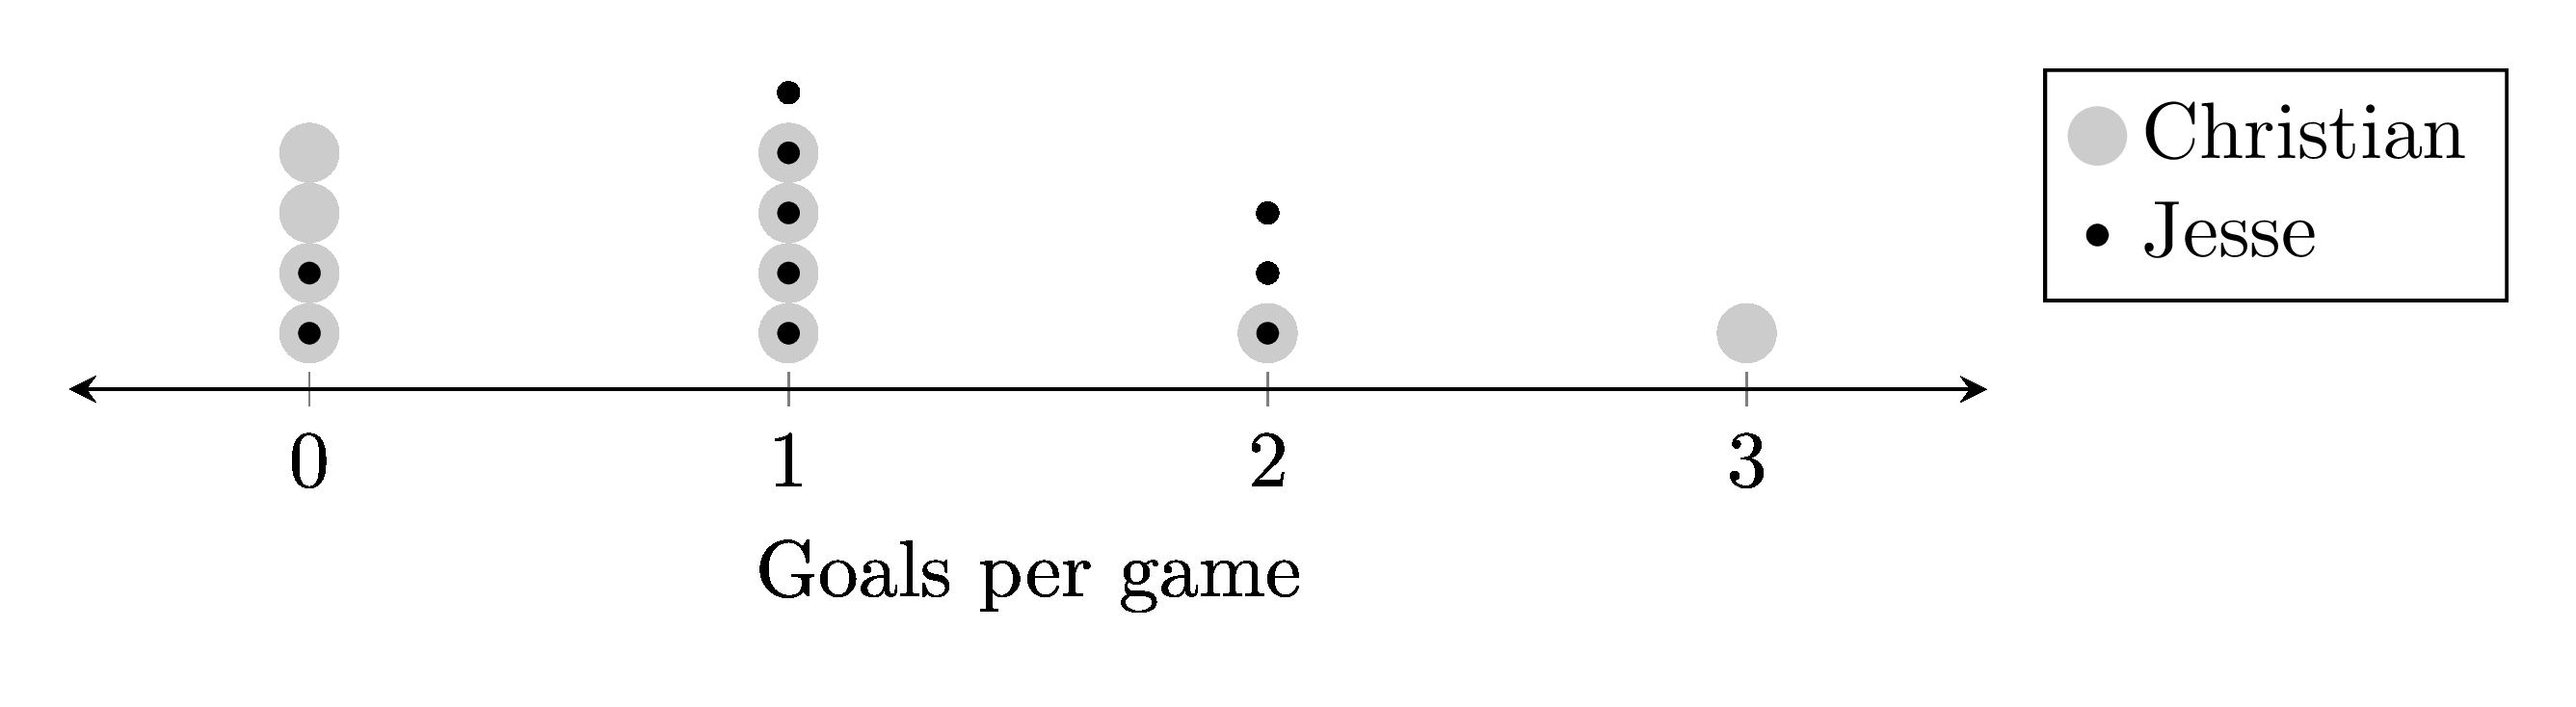
Goals per game
Christian
0 3 1 0 1 2 1 0 0 1
Jesse
1 2 0 1 0 1 2 2 1 1
3.3. Png file
The .png file is shown below.
3.4. Python code
The python code is shown below.
# standard numpy and matplotlib library imports
import numpy as np
from pathlib import Path
import subprocess
import os
from tkinter import filedialog
import time
import magick_pdf_to_png

currfile_dir = Path(__file__).parent
tex_template_path = currfile_dir / "parallel_overlay_dot_plot_template.tex"


def convert_to_pdf(tex_path, outputdir):
    tex_path = Path(tex_path).resolve()
    outputdir = Path(outputdir).resolve()
    # for testing
    # print(f"tex_path: {tex_path}")
    # print(f"outputdir: {outputdir}")
    try:
        # Generate the PDF
        subprocess.run(["latexmk", "-pdf", "-outdir=" + str(outputdir), str(tex_path)], check=True, stdout=subprocess.DEVNULL, stderr=subprocess.DEVNULL)
        # # Clean auxiliary files after successful PDF generation
        subprocess.run(["latexmk", "-c", "-outdir=" + str(outputdir), str(tex_path)], check=True, stdout=subprocess.DEVNULL, stderr=subprocess.DEVNULL)
        # for hosted remove stdout=subprocess.DEVNULL, stderr=subprocess.DEVNULL for debugging any errors
        # Remove the .tex file manually
        if tex_path.exists():
            os.remove(tex_path)
    except subprocess.CalledProcessError as e:
        print(f"Error: {e}")


def get_dp2_np_array(filename):
    # open the text file and read the numbers
    with open(filename) as f:
        # read the first line and store it in a variable
        plot_xlabel = f.readline().strip()
        # read the second line and store it in a variable
        plot_title = f.readline().strip()
          # read the third line and store it in a variable
        numbers_string = f.readline().strip()
        if ", " in numbers_string:
            numbers = numbers_string.split(", ")
        elif "," in numbers_string:
            numbers = numbers_string.split(",")
        else:
            numbers = numbers_string.split(" ")
        # read the fourth line and store it in a variable
        plot_title2 = f.readline().strip()
        # read the fifth line and store it in a variable
        numbers_string2 = f.readline().strip()
        if ", " in numbers_string2:
            numbers2 = numbers_string2.split(", ")
        elif "," in numbers_string2:
            numbers2 = numbers_string2.split(",")
        else:
            numbers2 = numbers_string2.split(" ")
    # convert the numbers strings to integers
    if "." in numbers_string:
        numbers = [float(n) for n in numbers]
    else:
        numbers = [int(n) for n in numbers]
    # convert the numbers strings to integers
    if "." in numbers_string2:
        numbers2 = [float(n) for n in numbers2]
    else:
        numbers2 = [int(n) for n in numbers2]
    # create a numpy array from the numbers
    return plot_xlabel, plot_title, np.array(numbers), plot_title2, np.array(numbers2)


def dotplot(input_x):
    # get 2 arrays in order with counts for each value
    unique_values, counts = np.unique(input_x, return_counts=True)
    # get max counts for pdf height
    max_counts = np.max(counts)
    # # Convert into coordinates space delimited for latex
    coords = ""
    for idx, value in enumerate(unique_values):
        for counter in range(1, counts[idx] + 1):
            coord = (value, counter)
            coords += str(coord)
    return coords, max_counts


def main():
    data_filename = filedialog.askopenfilename(initialdir=Path(currfile_dir))
    if data_filename == "":
        print("Exited, by clicking Cancel")
        return
    plot_xlabel, plot_title, num_array ,plot_title2, num_array2 = get_dp2_np_array(data_filename)
    # print(plot_xlabel, plot_title, num_array ,plot_title2, num_array2)

    latex_coords, max_counts = dotplot(num_array)
    latex_coords2, max_counts2 = dotplot(num_array2)
    height1 = min(8, 1.6 + max_counts/4)
    height2 = min(8, 1.6 + max_counts2/4)
    overlay_height = str(max(height1,height2))
    # print(pdf_height)
    # Get the maximum value and min vlaues for ticks
    min_tval = min(np.min(num_array),np.min(num_array2))
    min_tplus1 = min_tval + 1
    min_tval = str(min_tval)
    min_tplus1 = str(min_tplus1)
    max_tval = str(max(np.max(num_array),np.max(num_array2)))

    # Get the maximum value and the minimum value for axis
    max_val = str(max(np.max(num_array),np.max(num_array2)) + 0.5)
    min_val = str(min(np.min(num_array),np.min(num_array2)) - 0.5)

    # Create a Path object from the file path
    path_obj = Path(data_filename)

    # Get the file name from the Path object using the name attribute
    filename = path_obj.stem
    # filename = input("Enter the base filename to be added to the prefix dp_: \n")
    # if not filename:
    #     filename = "dp_1"
    # set names of files that are made
    tex_output_path = currfile_dir / f"{filename}.tex"
    pdf_path = currfile_dir / f"{filename}.pdf"
    png_path = currfile_dir / f"{filename}.png"

    # Read in the LaTeX template file
    with open(tex_template_path, "r") as infile:
        tex_template_txt = infile.read()

    # Replace the placeholders in the LaTeX template
    tex_template_txt = tex_template_txt.replace("<<height>>", overlay_height)
    tex_template_txt = tex_template_txt.replace("<<xlabel>>", plot_xlabel)
    tex_template_txt = tex_template_txt.replace("<<min_tval>>", min_tval)
    tex_template_txt = tex_template_txt.replace("<<min_tplus1>>", min_tplus1)
    tex_template_txt = tex_template_txt.replace("<<max_tval>>", max_tval)

    tex_template_txt = tex_template_txt.replace("<<coords>>", latex_coords)
    tex_template_txt = tex_template_txt.replace("<<title>>", plot_title)
    tex_template_txt = tex_template_txt.replace("<<max_val>>", max_val)
    tex_template_txt = tex_template_txt.replace("<<min_val>>", min_val)

    tex_template_txt = tex_template_txt.replace("<<coords2>>", latex_coords2)
    tex_template_txt = tex_template_txt.replace("<<title2>>", plot_title2)
    tex_template_txt = tex_template_txt.replace("<<max_val2>>", max_val)
    tex_template_txt = tex_template_txt.replace("<<min_val2>>", min_val)


    # Write the question tex to an output file
    with open(tex_output_path, "w") as outfile:
        outfile.write(tex_template_txt)

    # Wait for the files to be created
    time.sleep(1)
    # Convert the LaTeX files to PDFs
    convert_to_pdf(tex_output_path, currfile_dir)

    # Wait for the files to be created
    time.sleep(1)
    # Convert the PDFs to PNGs
    magick_pdf_to_png.convert_pdf_to_png(pdf_path, png_path)


if __name__ == "__main__":
    print("starting")
    main()
    print("finished")