2. Parallel Dot plots
To build parallel dot plots diagrams, with one diagram below the other, python uses a .txt file and a .tex template.
The python file to make parallel dot plots is below.
The required LaTeX files are below.
The custom python modules required are:
A sample text file is below:
2.1. Distribution generators
Some small python scripts to generate distributions are provided here:
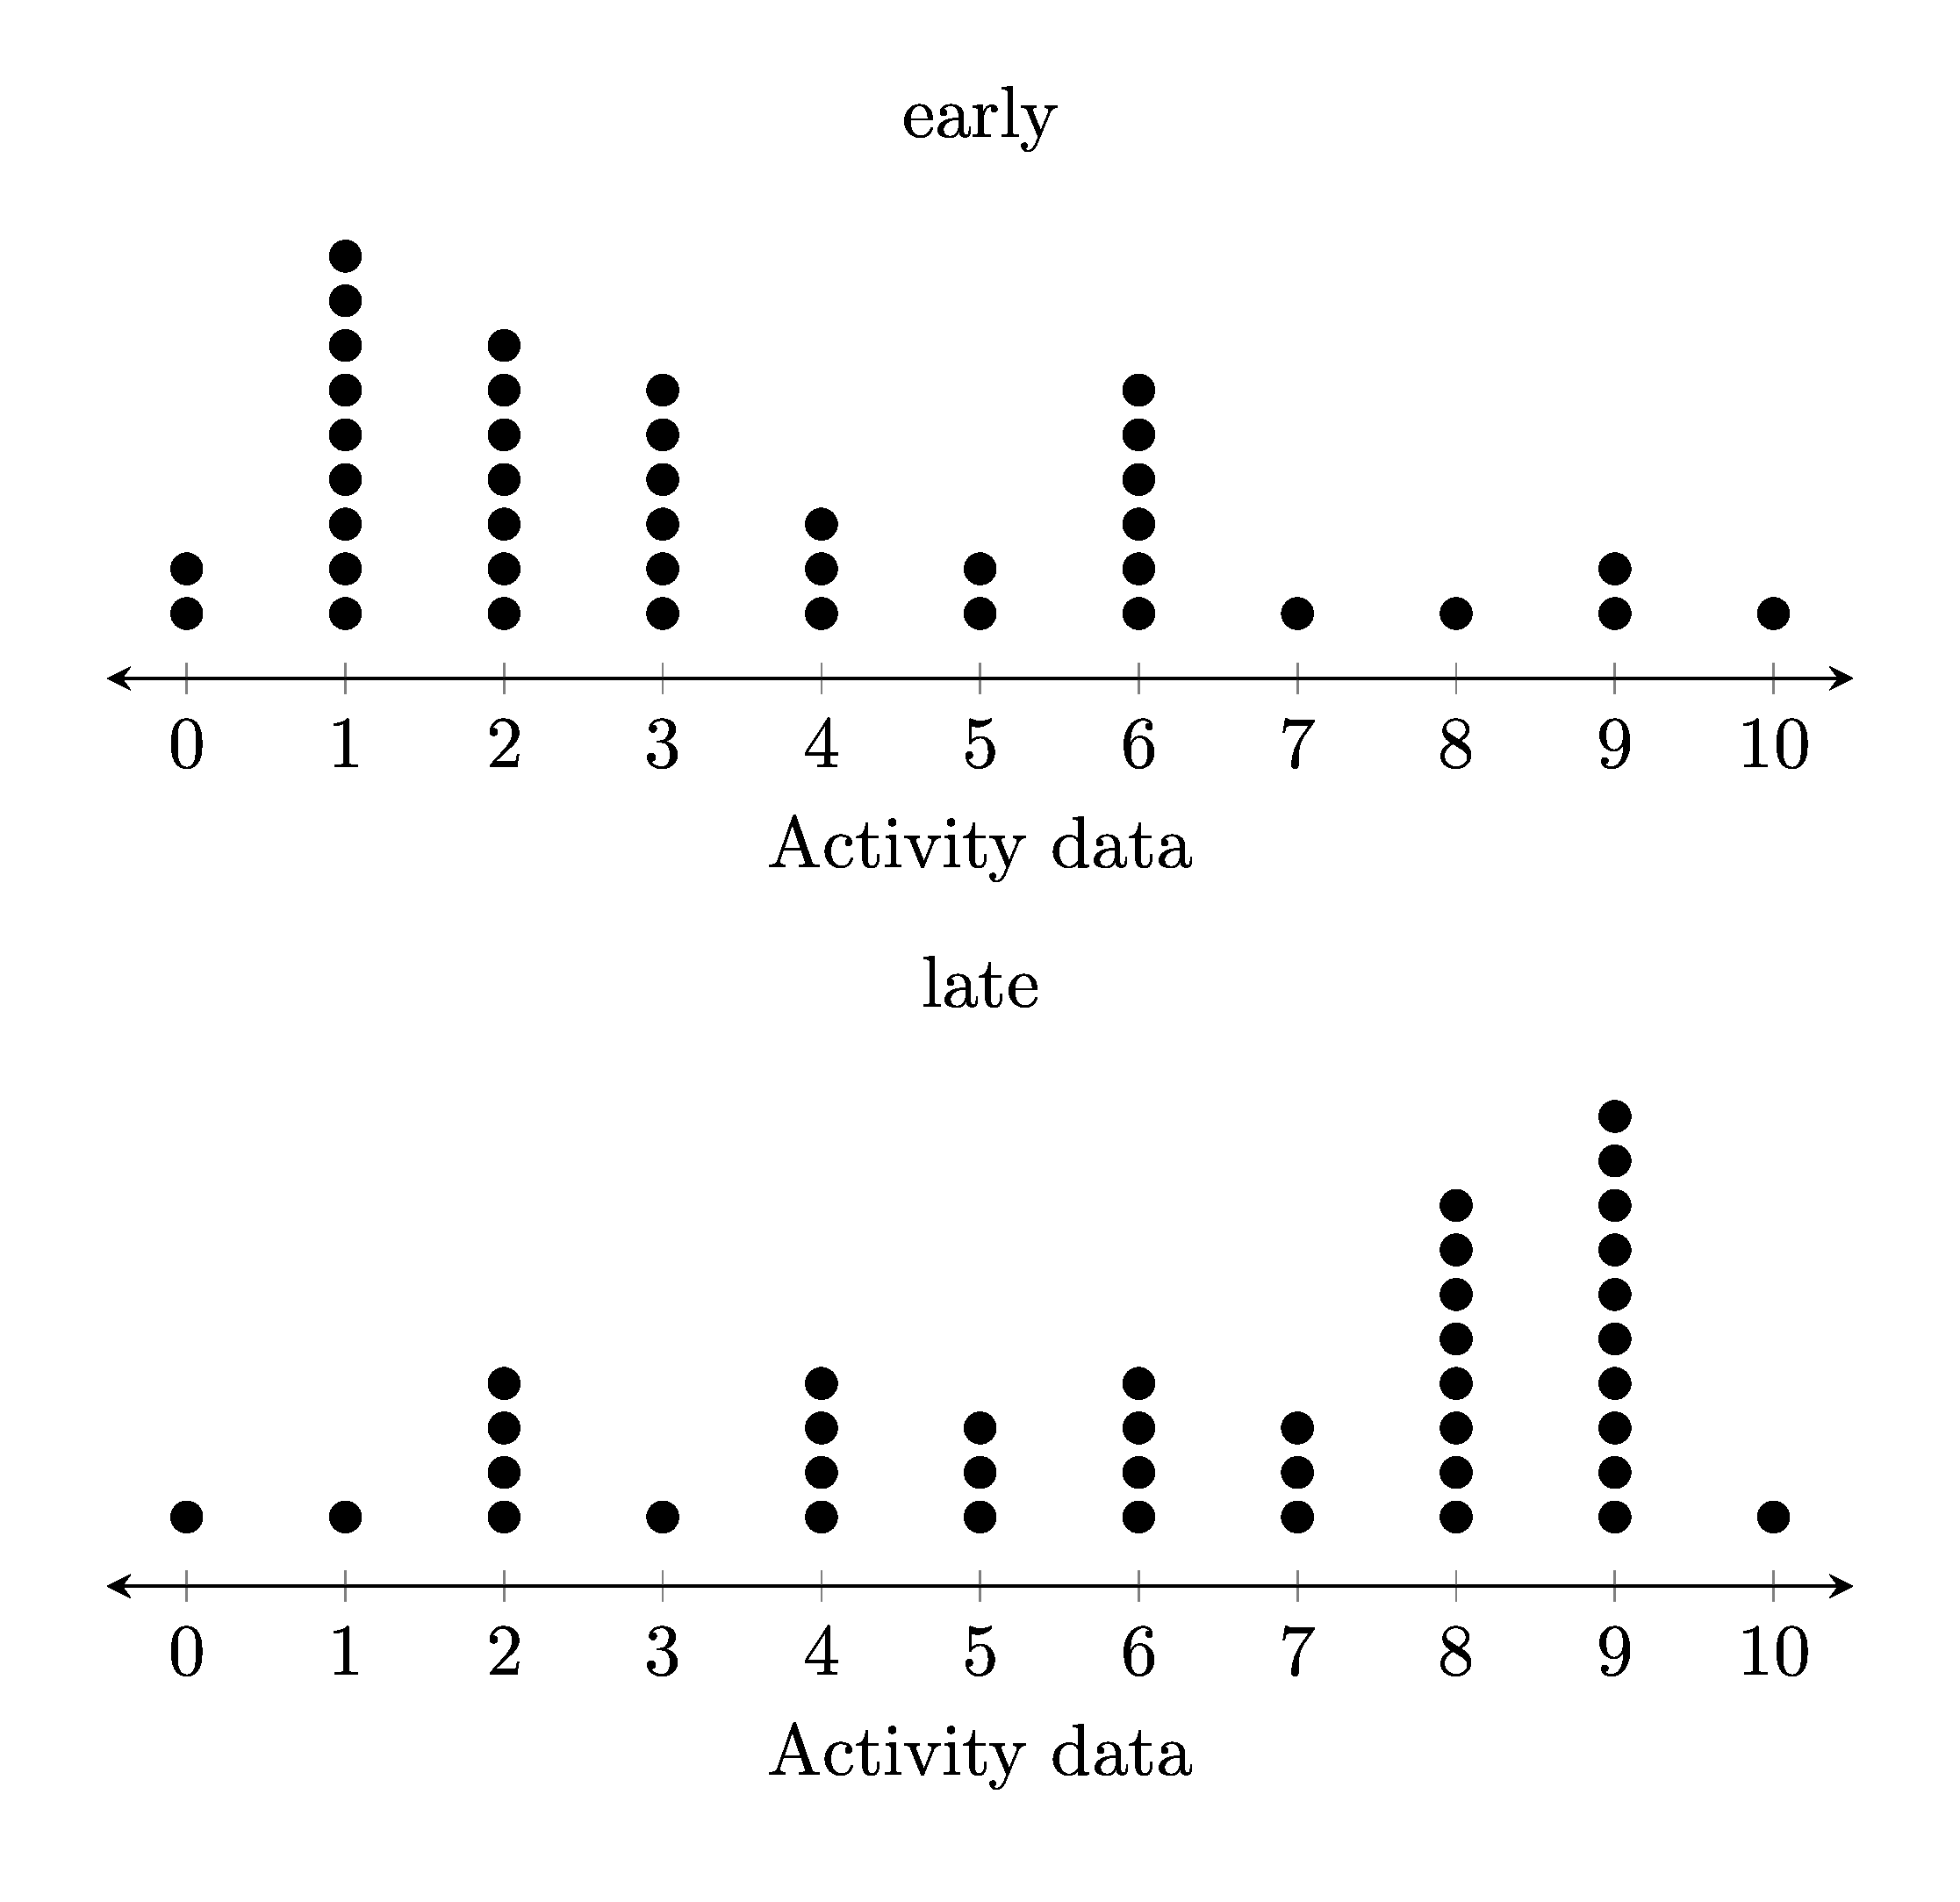
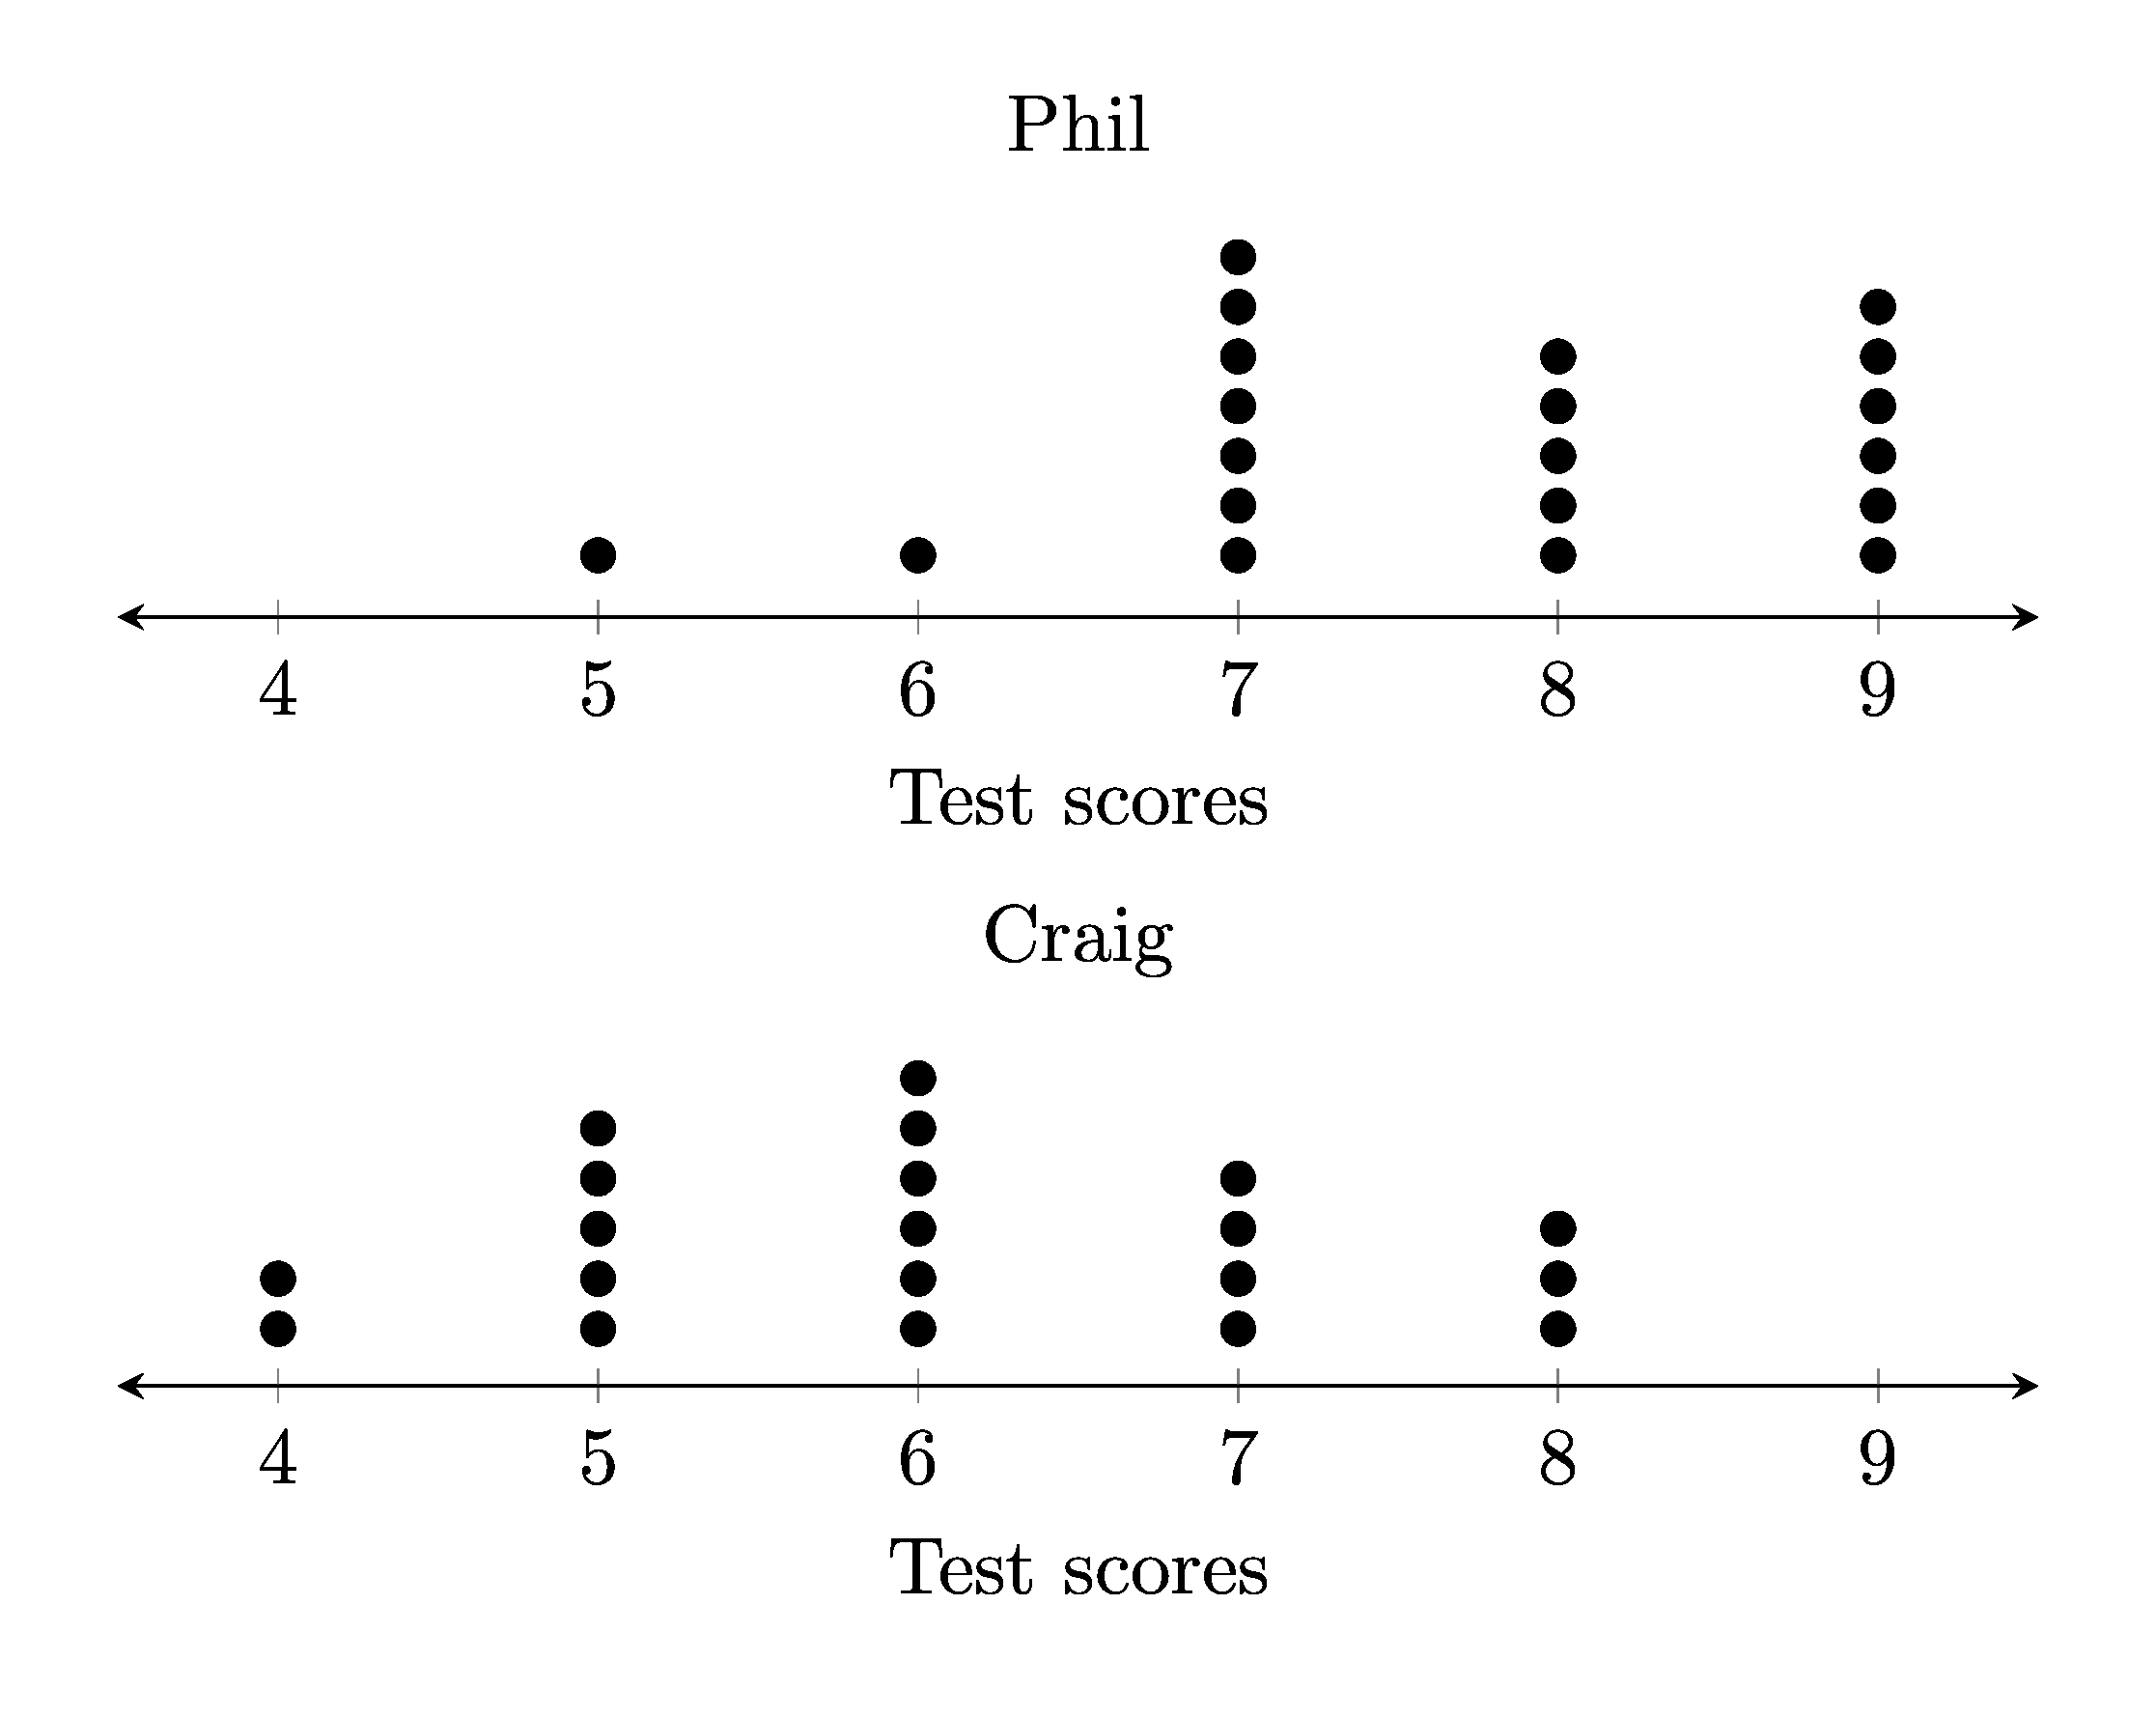
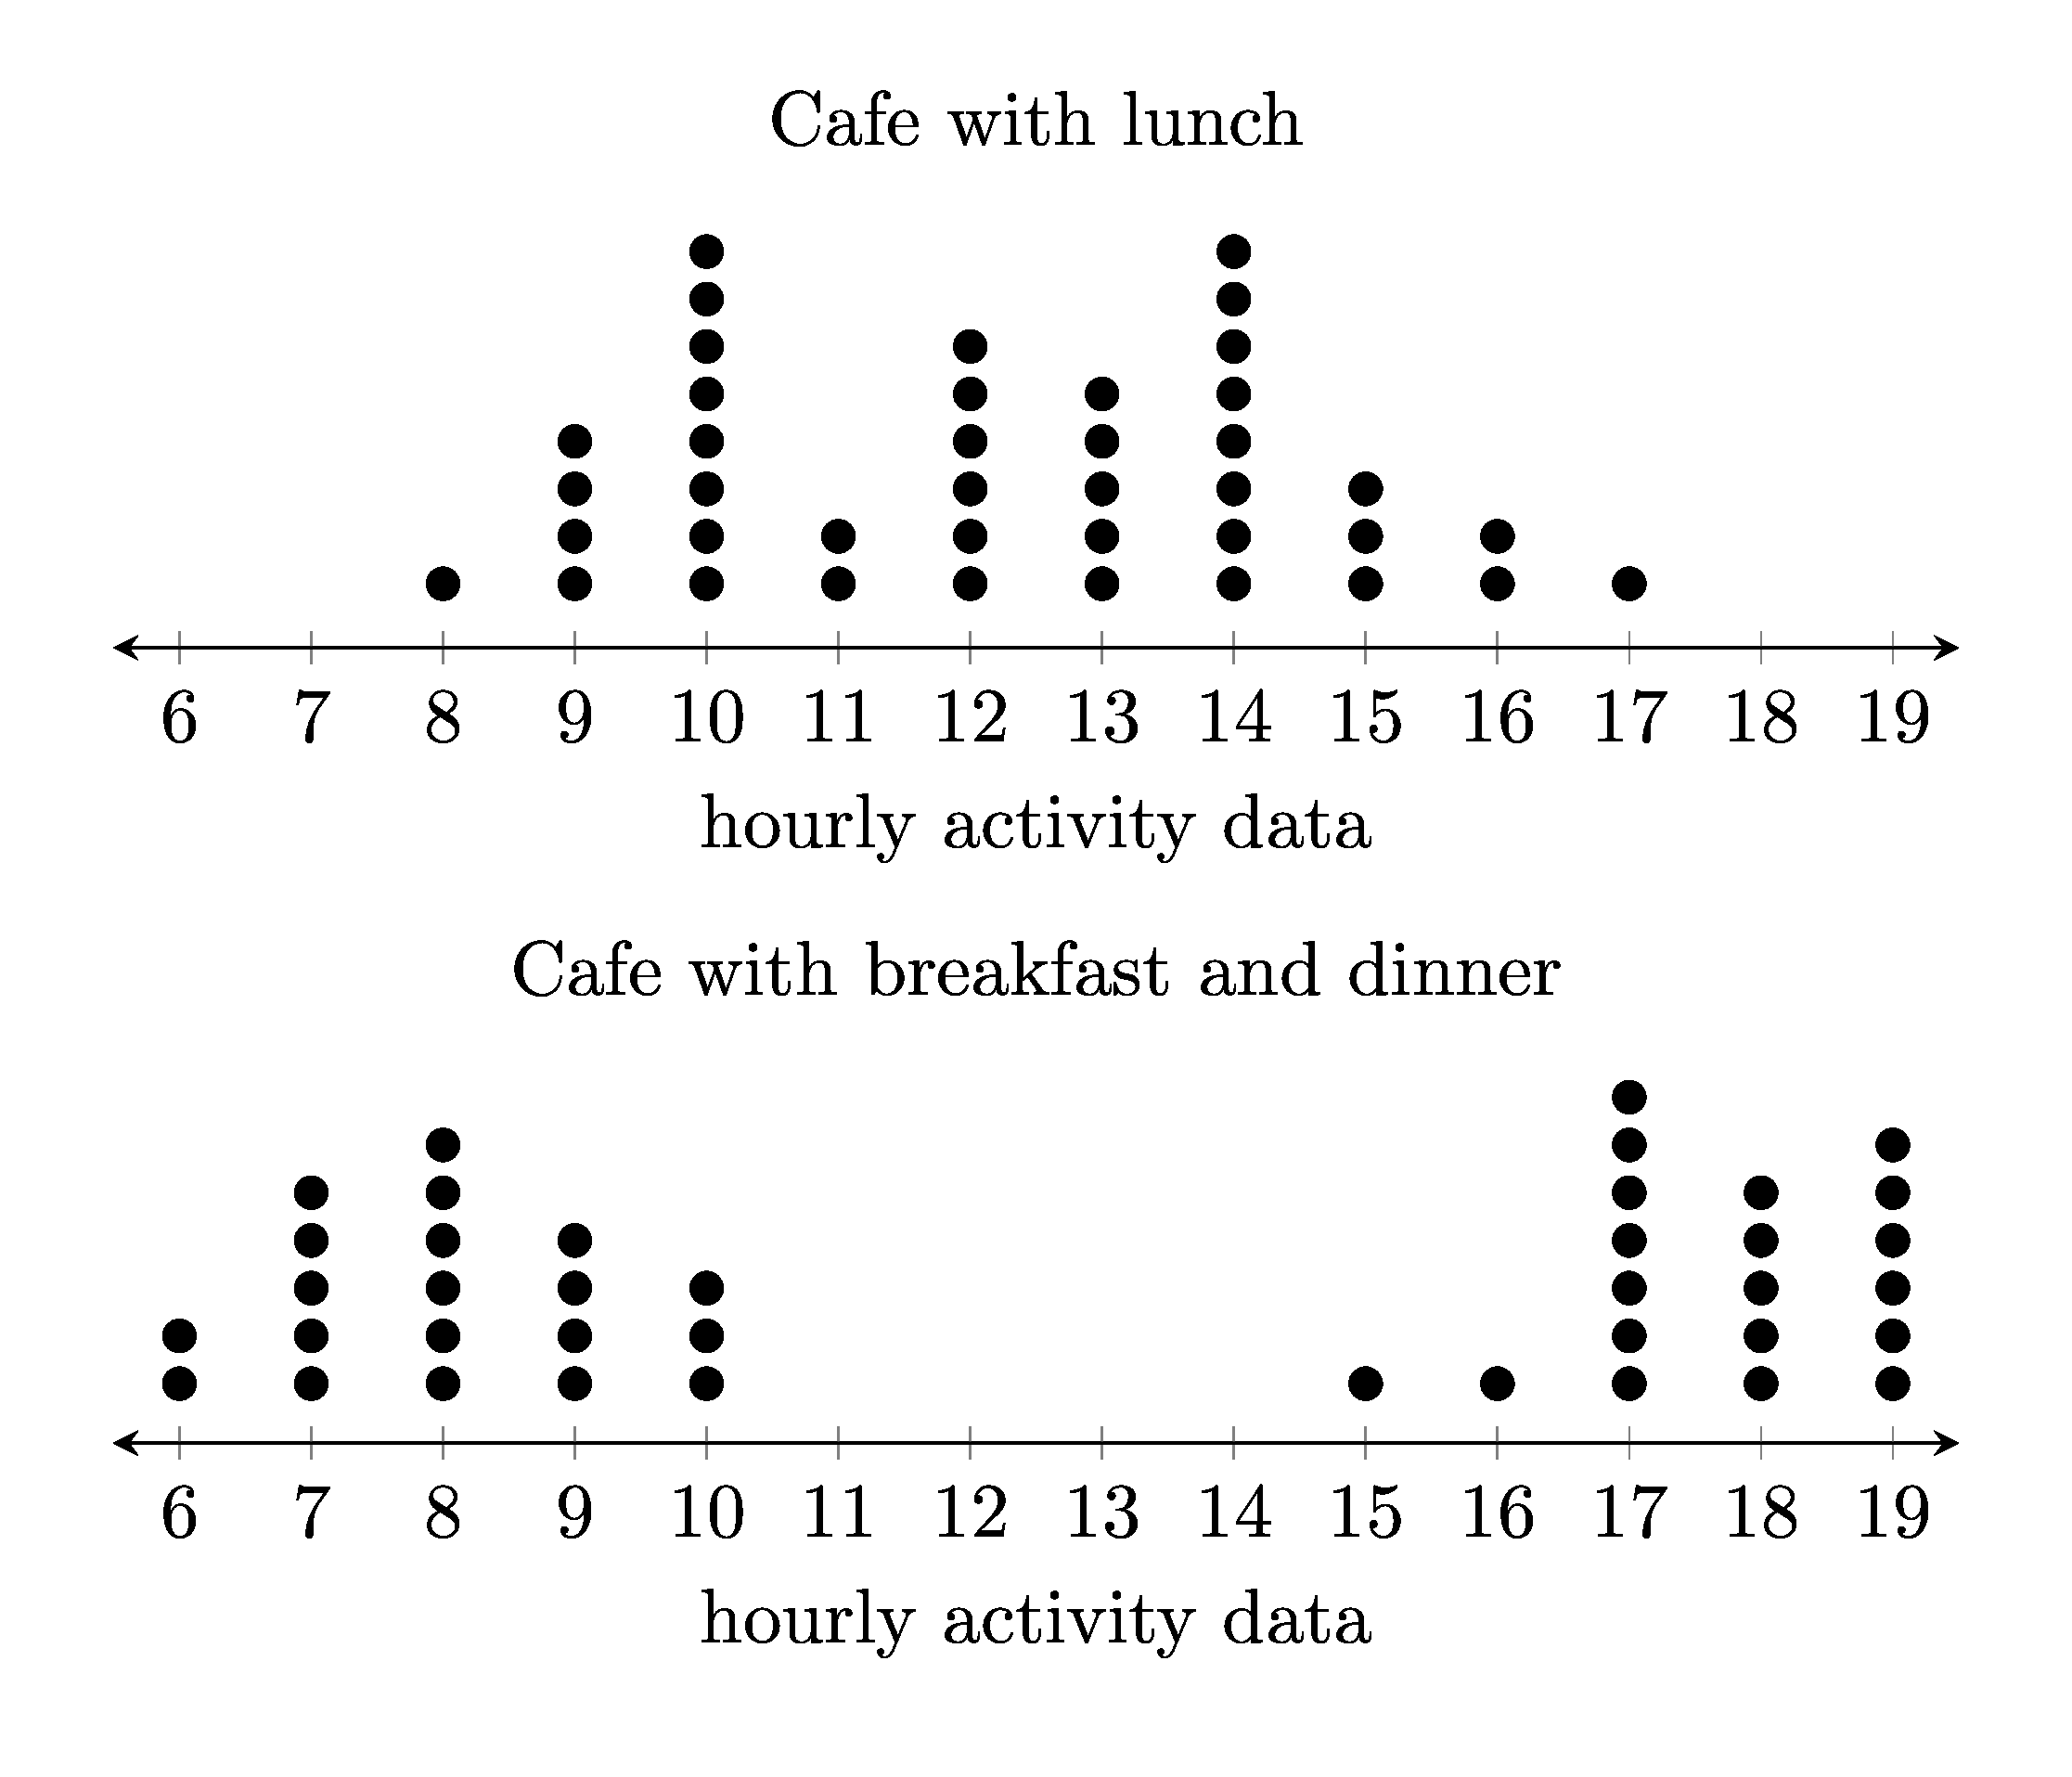
2.2. Example parallel dot plots

2.3. LaTeX
The .tex file template is shown below.
\documentclass[border = 3mmm]{standalone}
\usepackage{pgfplots}
\usepgfplotslibrary{groupplots}
\pgfplotsset{width=10cm,compat=newest}  % <<height>>

\begin{document}

\begin{tabular}{c}
\begin{tikzpicture}
    \begin{axis}[
        height=<<height1>>cm,
        xmin=<<min_val>>,
        xmax=<<max_val>>,
        % hide y axis,
        axis y line=none,
        axis x line=bottom,
        % set the precision of the x tick labels to be 0, which means no decimals
        % xticklabel style={/pgf/number format/precision=0},
        xtick={<<min_tval>>,<<min_tplus1>>,...,<<max_tval>>},
        axis x line shift={4pt},
        every outer x axis line/.append style={stealth-stealth},
        title={<<title>>},
        xlabel={<<xlabel>>}]
        \addplot [only marks, black, mark=*, mark size=2pt] coordinates{<<coords>>};
    \end{axis}
\end{tikzpicture}
\\
\begin{tikzpicture}
    \begin{axis}[
    height=<<height2>>cm,
    xmin=<<min_val2>>,
    xmax=<<max_val2>>,
    % hide y axis,
    axis y line=none,
    axis x line=bottom,
    xtick={<<min_tval>>,<<min_tplus1>>,...,<<max_tval>>},
    axis x line shift={4pt},
    every outer x axis line/.append style={stealth-stealth},
    mark=*,
    title={<<title2>>},
    xlabel={<<xlabel>>}]
    \addplot [only marks] coordinates{<<coords2>>};
    \end{axis}
\end{tikzpicture}
\\
\end{tabular}

\end{document}
2.4. Txt file
The .txt file is shown below.
5 lines store data:
line 1: the dot plot label
line 2: the first data label
line 3: a comma space separated list of numbers
line 4: the second data label
line 5: a comma space separated list of numbers
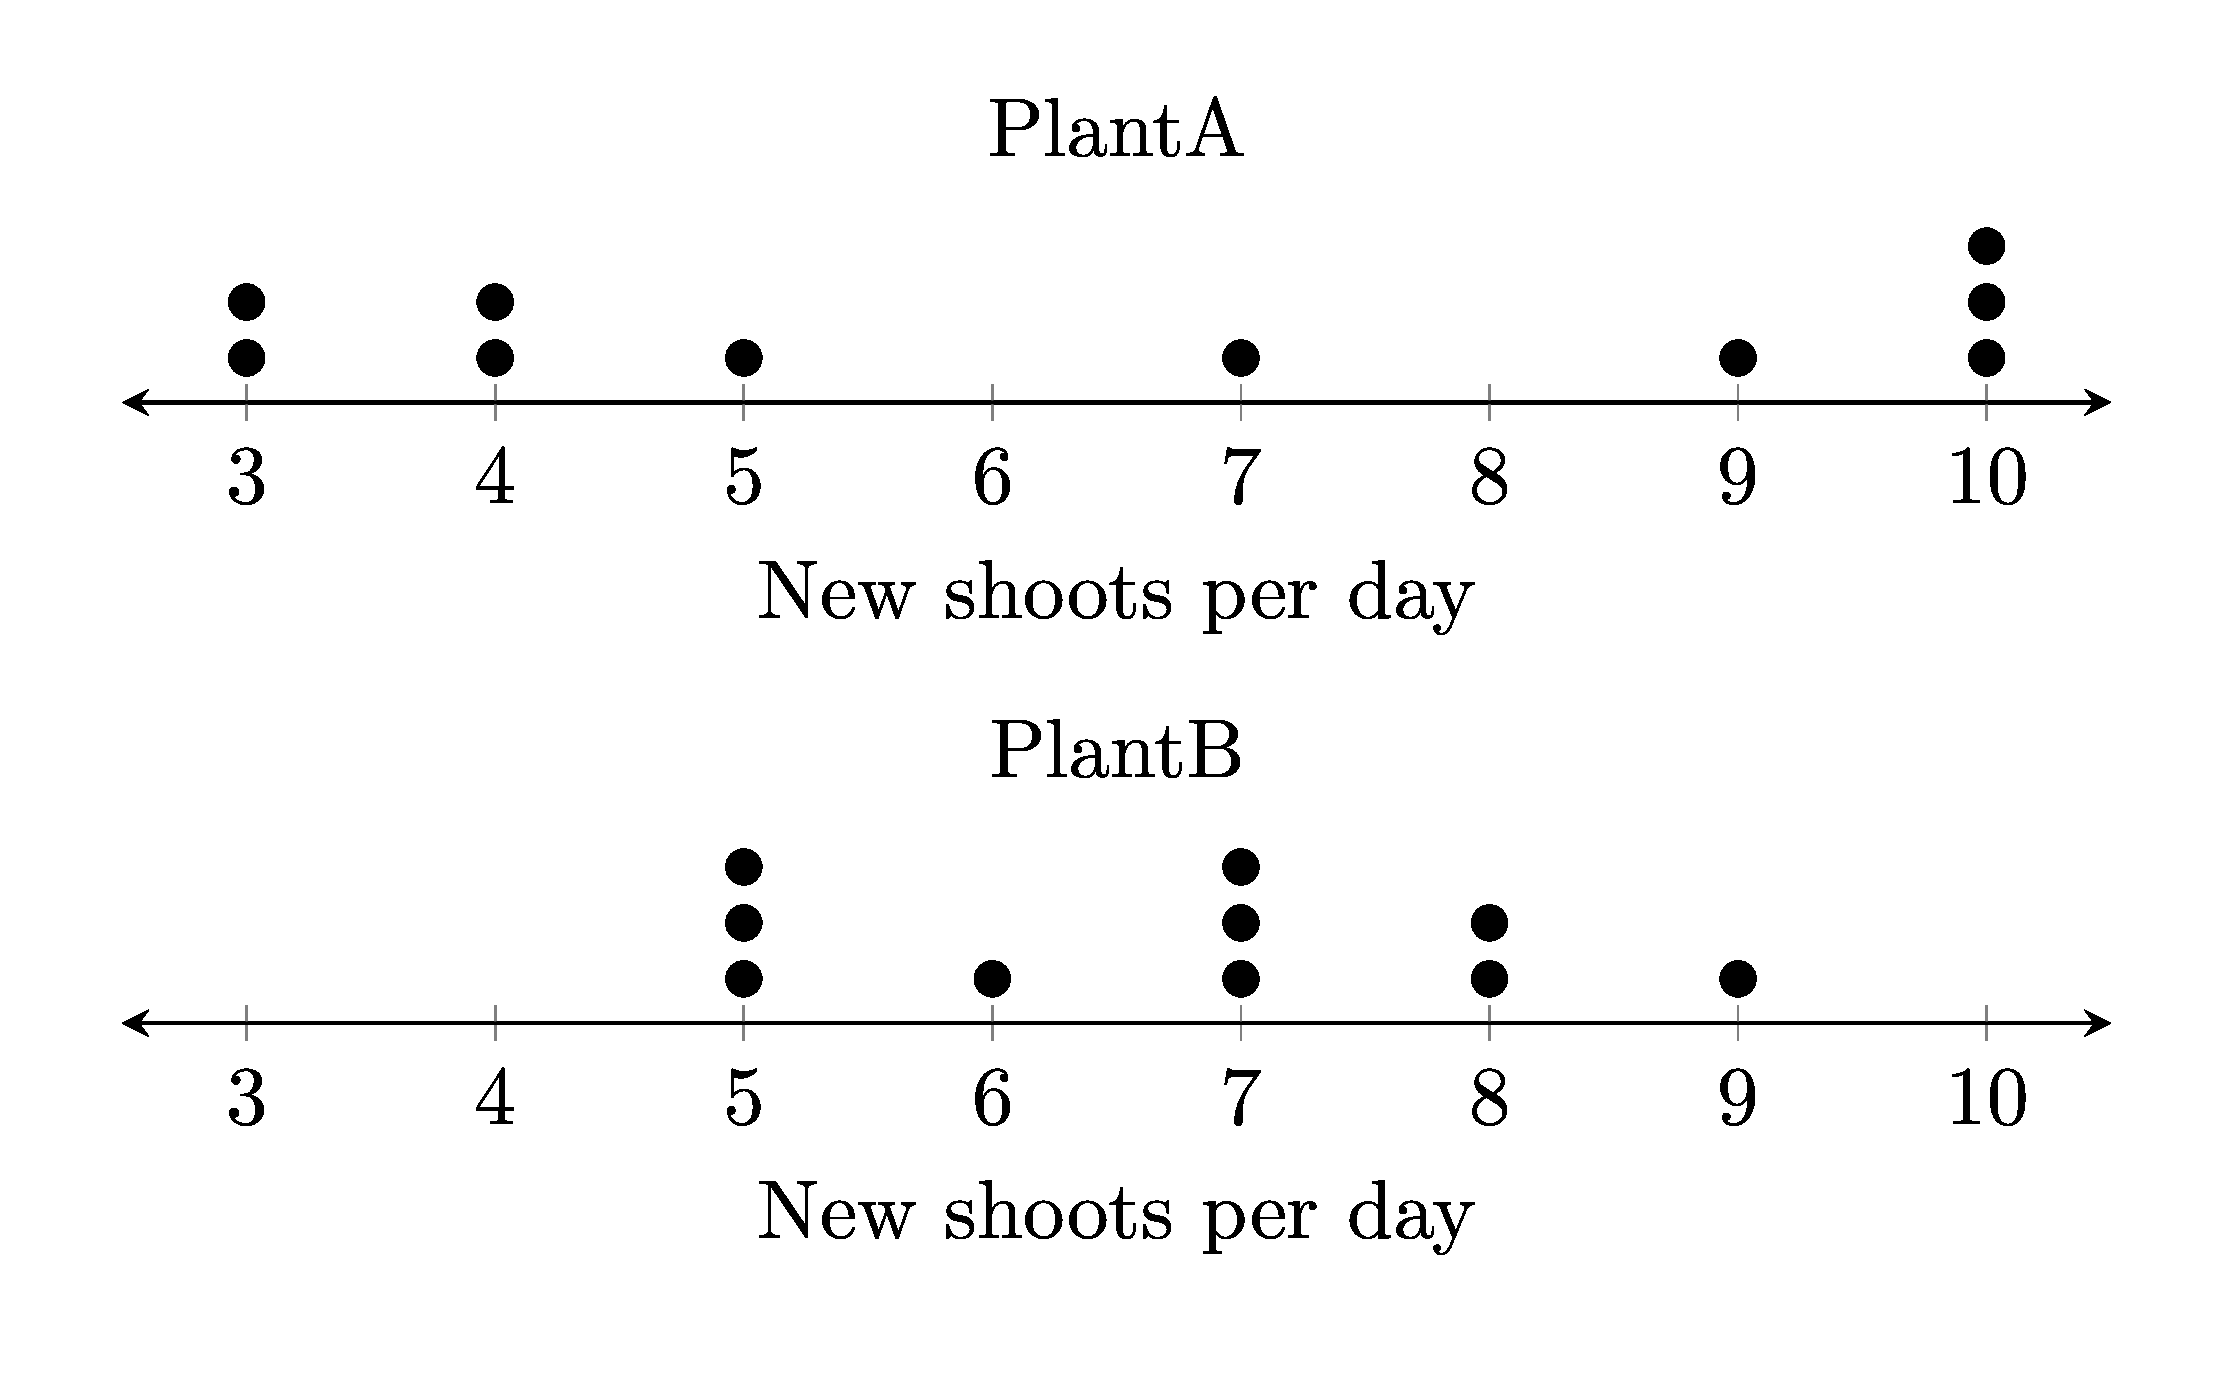
New shoots per day
PlantA
10,4,4,5,7,10,3,3,9,10
PlantB
8,7,5,5,9,7,8,7,5,6
2.5. Png file
The .png file is shown below.

2.6. Python code
The python code is shown below.
# standard numpy and matplotlib library imports
import numpy as np
from pathlib import Path
import subprocess
import os
from tkinter import filedialog
import time
import magick_pdf_to_png

currfile_dir = Path(__file__).parent
tex_template_path = currfile_dir / "parallel_dot_plot_template.tex"


def convert_to_pdf(tex_path, outputdir):
    tex_path = Path(tex_path).resolve()
    outputdir = Path(outputdir).resolve()
    # for testing
    # print(f"tex_path: {tex_path}")
    # print(f"outputdir: {outputdir}")
    try:
        # Generate the PDF
        subprocess.run(
            ["latexmk", "-pdf", "-outdir=" + str(outputdir),
             str(tex_path)],
            check=True,
            stdout=subprocess.DEVNULL,
            stderr=subprocess.DEVNULL)
        # # Clean auxiliary files after successful PDF generation
        subprocess.run(
            ["latexmk", "-c", "-outdir=" + str(outputdir),
             str(tex_path)],
            check=True,
            stdout=subprocess.DEVNULL,
            stderr=subprocess.DEVNULL)
        # for hosted remove stdout=subprocess.DEVNULL, stderr=subprocess.DEVNULL for debugging any errors
        # Remove the .tex file manually
        if tex_path.exists():
            os.remove(tex_path)
    except subprocess.CalledProcessError as e:
        print(f"Error: {e}")


def get_dp2_np_array(filename):
    # open the text file and read the numbers
    with open(filename) as f:
        # read the first line and store it in a variable
        plot_xlabel = f.readline().strip()
        # read the second line and store it in a variable
        plot_title = f.readline().strip()
        # read the third line and store it in a variable
        numbers_string = f.readline().strip()
        if ", " in numbers_string:
            numbers = numbers_string.split(", ")
        elif "," in numbers_string:
            numbers = numbers_string.split(",")
        else:
            numbers = numbers_string.split(" ")
        # read the fourth line and store it in a variable
        plot_title2 = f.readline().strip()
        # read the fifth line and store it in a variable
        numbers_string2 = f.readline().strip()
        if ", " in numbers_string2:
            numbers2 = numbers_string2.split(", ")
        elif "," in numbers_string2:
            numbers2 = numbers_string2.split(",")
        else:
            numbers2 = numbers_string2.split(" ")
    # convert the numbers strings to integers
    if "." in numbers_string:
        numbers = [float(n) for n in numbers]
    else:
        numbers = [int(n) for n in numbers]
    # convert the numbers strings to integers
    if "." in numbers_string2:
        numbers2 = [float(n) for n in numbers2]
    else:
        numbers2 = [int(n) for n in numbers2]
    # create a numpy array from the numbers
    return plot_xlabel, plot_title, np.array(numbers), plot_title2, np.array(numbers2)


def dotplot(input_x):
    # get 2 arrays in order with counts for each value
    unique_values, counts = np.unique(input_x, return_counts=True)
    # get max counts for pdf height
    max_counts = np.max(counts)
    # # Convert into coordinates space delimited for latex
    coords = ""
    for idx, value in enumerate(unique_values):
        for counter in range(1, counts[idx] + 1):
            coord = (value, counter)
            coords += str(coord)
    return coords, max_counts


def main():
    data_filename = filedialog.askopenfilename(initialdir=Path(currfile_dir))
    if data_filename == "":
        print("Exited, by clicking Cancel")
        return
    plot_xlabel, plot_title, num_array ,plot_title2, num_array2 = get_dp2_np_array(data_filename)
    # print(plot_xlabel, plot_title, num_array ,plot_title2, num_array2)

    latex_coords, max_counts = dotplot(num_array)
    latex_coords2, max_counts2 = dotplot(num_array2)
    height1 = str(min(8, 1.4 + max_counts/4))
    height2 = str(min(8, 1.4 + max_counts2/4))
    # print(pdf_height)
    # Get the maximum value and min vlaues for ticks
    min_tval = min(np.min(num_array),np.min(num_array2))
    min_tplus1 = min_tval + 1
    min_tval = str(min_tval)
    min_tplus1 = str(min_tplus1)
    max_tval = str(max(np.max(num_array),np.max(num_array2)))

    # Get the maximum value and the minimum value for axis
    max_val = str(max(np.max(num_array),np.max(num_array2)) + 0.5)
    min_val = str(min(np.min(num_array),np.min(num_array2)) - 0.5)

    # Create a Path object from the file path
    path_obj = Path(data_filename)

    # Get the file name from the Path object using the name attribute
    filename = path_obj.stem
    # filename = input("Enter the base filename to be added to the prefix dp_: \n")
    # if not filename:
    #     filename = "dp_1"
    # set names of files that are made
    tex_output_path = currfile_dir / f"{filename}.tex"
    pdf_path = currfile_dir / f"{filename}.pdf"
    png_path = currfile_dir / f"{filename}.png"

    # Read in the LaTeX template file
    with open(tex_template_path, "r") as infile:
        tex_template_txt = infile.read()

    # Replace the placeholders in the LaTeX template
    tex_template_txt = tex_template_txt.replace("<<xlabel>>", plot_xlabel)
    tex_template_txt = tex_template_txt.replace("<<min_tval>>", min_tval)
    tex_template_txt = tex_template_txt.replace("<<min_tplus1>>", min_tplus1)
    tex_template_txt = tex_template_txt.replace("<<max_tval>>", max_tval)

    tex_template_txt = tex_template_txt.replace("<<height1>>", height1)
    tex_template_txt = tex_template_txt.replace("<<coords>>", latex_coords)
    tex_template_txt = tex_template_txt.replace("<<title>>", plot_title)
    tex_template_txt = tex_template_txt.replace("<<max_val>>", max_val)
    tex_template_txt = tex_template_txt.replace("<<min_val>>", min_val)

    tex_template_txt = tex_template_txt.replace("<<height2>>", height2)
    tex_template_txt = tex_template_txt.replace("<<coords2>>", latex_coords2)
    tex_template_txt = tex_template_txt.replace("<<title2>>", plot_title2)
    tex_template_txt = tex_template_txt.replace("<<max_val2>>", max_val)
    tex_template_txt = tex_template_txt.replace("<<min_val2>>", min_val)


    # Write the question tex to an output file
    with open(tex_output_path, "w") as outfile:
        outfile.write(tex_template_txt)

    # Wait for the files to be created
    time.sleep(1)
    # Convert the LaTeX files to PDFs
    convert_to_pdf(tex_output_path, currfile_dir)

    # Wait for the files to be created
    time.sleep(1)
    # Convert the PDFs to PNGs
    magick_pdf_to_png.convert_pdf_to_png(pdf_path, png_path)


if __name__ == "__main__":
    print("starting")
    main()
    print("finished")