2. Number Lines - manual
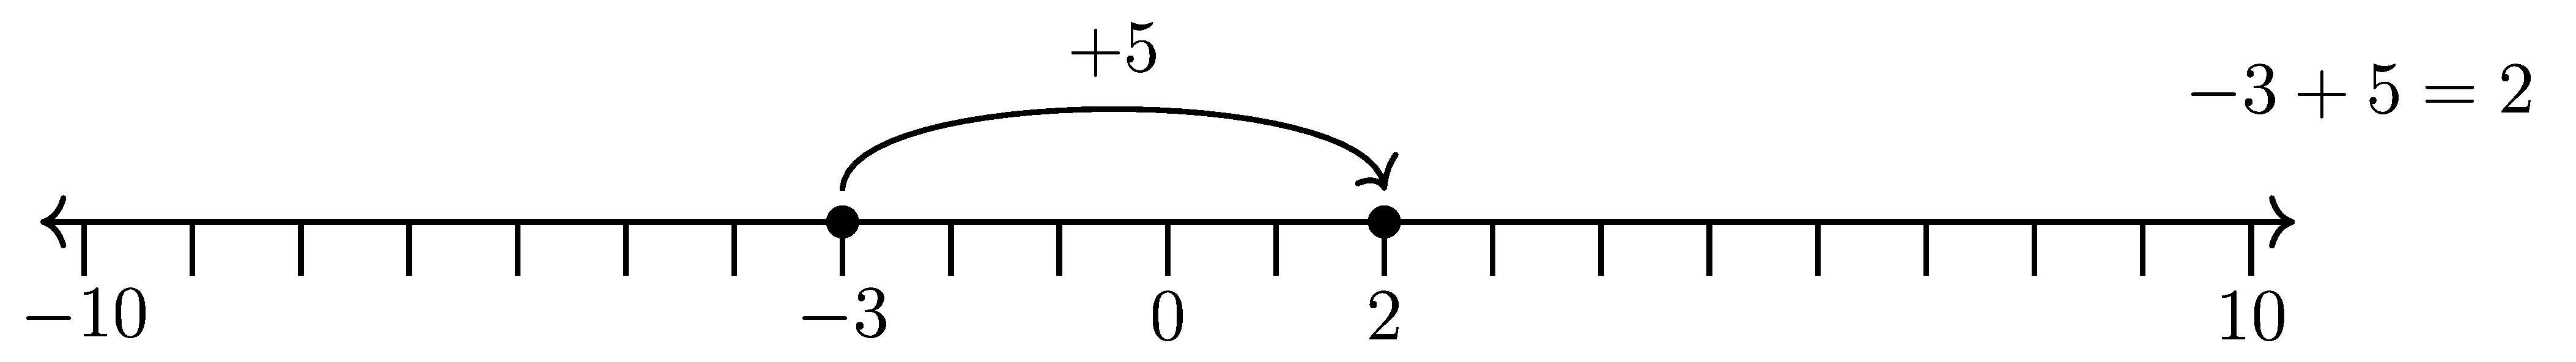
2.1. A number line diagram with answers
2.2. number lines LaTeX
A LaTeX .tex file consists of two parts, the preamble and the main document.
2.3. LaTeX preamble
% numberline
\documentclass[preview,12pt]{standalone}
\usepackage{tikz}
\usetikzlibrary{positioning}
\usetikzlibrary {arrows.meta}
\usetikzlibrary{bending}
\usepackage[a4paper, portrait, margin=1cm]{geometry}

\def\jumpheight{10}
% \def\qgap{\rule[-1pt]{1.0em}{.25pt}}
defqgap{raisebox{-1pt}{dotuline{phantom{X}}}}
% modify values for number lines defstartval{-3} defendval{2} % values for display defstartvaltxt{startval} defendvaltxt{endval} defchangevaltxt{+5} defequtxt{-3 + 5 = 2} % end modify values for number lines
2.3.1. Document class
\documentclass[preview,12pt]{standalone} is used to define a document that can be used to create graphics that are self-contained and can be easily included in other documents.2.3.2. tikz package
\usepackage{tikz} imports the TikZ package which allows you to create diagrams and graphics programmatically, such as points, lines and paths, circles, ellipses and rectangles.\usetikzlibrary{positioning} is used to import the positioning library which provides advanced positioning options for nodes (points in a diagram that can be referenced and used to draw lines or shapes).\usetikzlibrary{arrows.meta} loads the arrows.meta library, which provides more options for customizing the appearance of arrows in tikz diagrams. This library allows you to use different arrow tip styles and to adjust the size and shape of arrow tips.\usetikzlibrary{bending} loads the bending library, which improves the appearance of arrows that are attached to curved lines. This library makes the arrow tips follow the curvature of the line, resulting in a more natural-looking bend.2.3.3. arrows
\usetikzlibrary {arrows.meta} and \usetikzlibrary{bending} to create various types of arrows with TikZ.2.3.4. Macro definitions
\def\jumpheight{10} is used for consistency and easy adjustment of the height that the arrow goes up from the points in the number line.defqgap{raisebox{-1pt}{dotuline{phantom{X}}}}`` is used for placing an underline for space to write answers on a number line used in a question.
% modify values for number lines
\def\startval{-3}
\def\endval{2}
% values for display
\def\startvaltxt{\startval}
\def\endvaltxt{\endval}
\def\changevaltxt{+5}
\def\equtxt{-3 + 5 = 2}
% end modify values for number lines
2.3.5. Macro definitions and Variables
\def is used to define new commands in LaTeX.\def\commandname{replacement text}.\def\startval{-3} defines a new command named, \startval, that takes no arguments and expands to the text -3.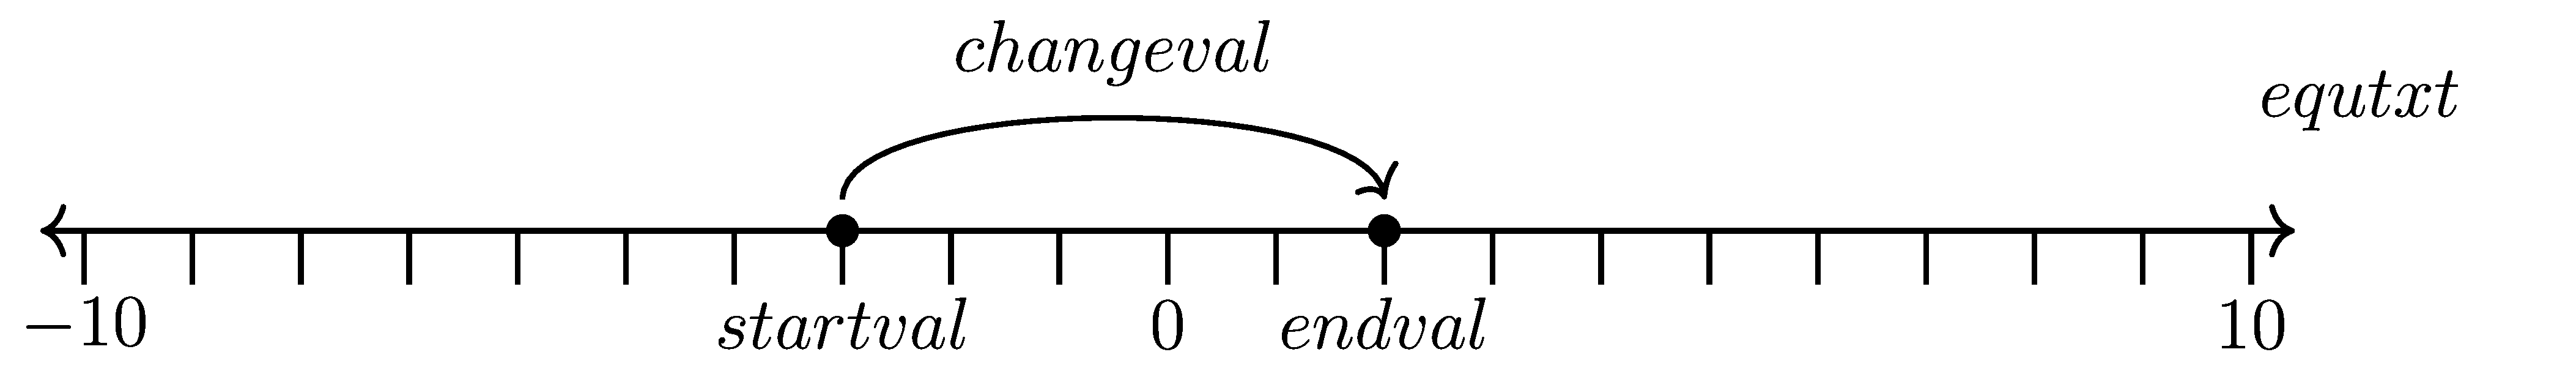
2.3.5.1. The document environment
\begin{document}
\begin{tikzpicture}[scale=0.67]
    % axis, arrow style to-to
    \draw[{To[scale=1.3]}-{To[scale=1.3]}, line width=1pt] (-10.4, 0) -- (10.4, 0);
    % tick marks
    \foreach \x in {-10,-9,...,10}
        \draw[shift={(\x,0)},color=black, line width=1pt] (0pt,-14pt) -- (0pt,0pt);
    % numbers along each axis
    \foreach \x in {-10,0,10}
        \draw[shift={(\x,-0.8)},color=black] node[font=\large,text height=12pt] {$\x$};
    % to display variables
    \draw[shift={(\startval,-0.8)},color=black] node[font=\large,text height=12pt] {$\startvaltxt$};
    \draw[shift={(\endval,-0.8)},color=black] node[font=\large,text height=12pt] {$\endvaltxt$};
    % dots
    \filldraw[black] (\startval,0) circle (4pt) node[above,yshift=-2pt] (a) {};
    \filldraw[black] (\endval,0) circle (4pt) node[above,yshift=-2pt] (b) {};
    % arrow
    \draw[-{To[scale=1.3, bend]},line width=1pt, color=black] (a.north)  .. controls  +(north:\jumpheight mm) and +(north:\jumpheight mm) .. node[above=2pt,text height=12pt,font=\large]{$\changevaltxt$} (b.north);
    % equation at right end
    \node [font=\large, anchor=east] at (15,1.65){$\equtxt$};
\end{tikzpicture}
\end{document}
2.3.6. Document
\begin{document} starts the body of the document. It is used to indicate the beginning of the text that will be typeset to appear in the output pdf.\end{document} command marks the end of the document2.3.7. tikzpicture
\begin{tikzpicture} is a command in LaTeX that creates a new picture environment.2.3.8. Diagram parts
These LaTeX lines create a graphic element using the tikzpicture environment, which is part of the TikZ package for creating diagrams. The lines do the following:
\begin{tikzpicture}[scale=0.67]starts the tikzpicture environment and sets the scale option to 0.80, which means that the graphic will be scaled down by 20%. This enables the line to be drawn with one tick every 1 cm before scaling it to fit on an A4 page.``draw[{To[scale=1.3]}-{To[scale=1.3]}, line width=1pt] (-10.4, 0) – (10.4, 0)``draws a horizontal line from (-10.4, 0) to (10.4, 0) with a thickness of 1pt and arrow tips at both ends. The arrow tips are customized using the arrows.meta library and the To shape with a scale of 1.3.
\foreach \x in {-10,-9,...,10}starts a loop that assigns values to the variable x from -10 to 10 with increments of 1.\draw[shift={(\x,0)},color=black, line width=1pt] (0pt,-14pt) -- (0pt,0pt)draws a vertical line segment from (0pt,-14pt) to (0pt,0pt) for each value of x, shifting the origin to (x,0) and using black color and 1pt thickness.\foreach \x in {-10,0,10}starts another loop that assigns values to the variable x for -10, 0 and 10.\draw[shift={(\x,-0.8)},color=black] node[font=\large,text height=12pt] {$\x$}places a node with the value of x below each tick mark on the horizontal axis, using a large font and a text height of 12pt.\draw[shift={(\startval,-0.8)},color=black] node[font=\large,text height=12pt] {$\startvaltxt$}places a node with the value of\startvaltxtbelow the tick mark corresponding to\startvalon the horizontal axis, using a large font and a text height of 12pt.\draw[shift={(\endval,-0.8)},color=black] node[font=\large,text height=12pt] {$\endvaltxt$}places a node with the value of\endvaltxtbelow the tick mark corresponding to\endvalon the horizontal axis, using a large font and a text height of 12pt.\filldraw[black] (\startval,0) circle (4pt) node[above,yshift=-2pt] (a) {}fills and draws a black circle with a radius of 4pt at(\startval,0)and names it(a). It also places an empty node above the circle with a vertical shift of -2pt.\filldraw[black] (\endval,0) circle (4pt) node[above,yshift=-2pt] (b) {}fills and draws a black circle with a radius of 4pt at(\endval,0)and names it(b). It also places an empty node above the circle with a vertical shift of -2pt.\draw[-{To[scale=1.3, bend]},line width=1pt, color=black] (a.north) .. controls +(north:\jumpheight mm) and +(north:\jumpheight mm) .. node[above=2pt,text height=12pt,font=\large]{$\changevaltxt$} (b.north)draws a curved line from the north anchor of node(a)to the north anchor of node(b), using an arrow tip at the end with a scale of 1.3 and a bend option that makes it follow the curvature of the path. The line has a thickness of 1pt and a black color. The curve is controlled by two points that are relative to the start and end points, using the + notation (see: https://en.wikibooks.org/wiki/LaTeX/PGF/TikZ#Specifying_coordinates). The points are shifted north by\jumpheightmm. The line also has a node above it with a vertical shift of 2pt, a text height of 12pt, a large font, and the text\changevaltxt.
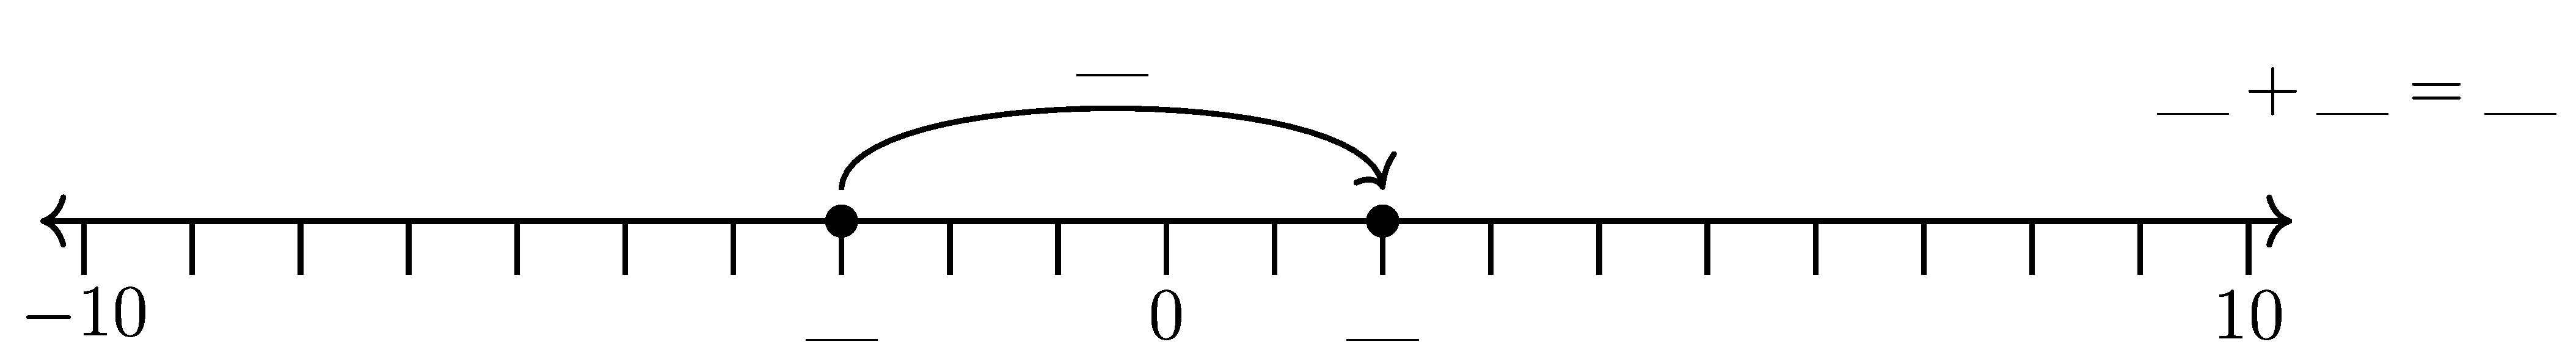
2.4. number lines LaTeX
 1% numberline
 2\documentclass[preview,12pt]{standalone}
 3\usepackage{tikz}
 4\usetikzlibrary{positioning}
 5\usetikzlibrary {arrows.meta}
 6\usetikzlibrary{bending}
 7\usepackage{ulem}
 8\usepackage[a4paper, portrait, margin=1cm]{geometry}
 9
10\def\jumpheight{10}
11% \def\qgap{\rule[-1pt]{1.0em}{.25pt}}
12\def\qgap{\raisebox{-1pt}{\dotuline{\phantom{X}}}}
13
14% modify values for number lines
15\def\minval{-10}
16\def\midval{0}
17\def\maxval{10}
18% modify values for number lines
19\def\startval{-3}
20\def\endval{2}
21
22% values for display
23\def\startvaltxt{\qgap}
24\def\endvaltxt{\qgap}
25\def\changevaltxt{\qgap}
26\def\equtxt{\qgap + \qgap=\qgap}
27% end modify values for number lines
28
29\begin{document}
30\begin{tikzpicture}[scale=0.67]
31    % axis, arrow style to-to
32    \draw[{To[scale=1.3]}-{To[scale=1.3]}, line width=1pt] (\minval-0.4, 0) -- (\maxval+0.4, 0);
33
34    % % tick marks
35    \pgfmathtruncatemacro{\nextmin}{\minval+1}
36    \foreach \x in {\minval,\nextmin,...,\maxval}
37        \draw[shift={(\x,0)},color=black, line width=1pt] (0pt,-14pt) -- (0pt,0pt);
38
39
40    % % numbers along each axis
41    \foreach \x in {\minval,\midval,\maxval} {
42        \pgfmathtruncatemacro\result{\x<0} % Converts boolean to 1 or 0
43        \ifnum\result=1
44            \draw[shift={(\x-0.3,-0.8)},color=black] node[font=\large,text height=12pt] {$\x$};
45        \else
46            \draw[shift={(\x,-0.8)},color=black] node[font=\large,text height=12pt] {$\x$};
47        \fi
48    }
49
50    % Start and end value labels
51    \draw[shift={(\startval,-0.8)},color=black] node[font=\large,text height=12pt] {$\startvaltxt$};
52    \draw[shift={(\endval,-0.8)},color=black] node[font=\large,text height=12pt] {$\endvaltxt$};
53
54    % dots
55    \filldraw[black] (\startval,0) circle (4pt) node[above,yshift=-2pt] (a) {};
56    \filldraw[black] (\endval,0) circle (4pt) node[above,yshift=-2pt] (b) {};
57
58    % arrow
59    \draw[-{To[scale=1.3, bend]},line width=1pt, color=black] (a.north)
60        .. controls  +(north:\jumpheight mm) and +(north:\jumpheight mm) ..
61        node[above=2pt,xshift=-6pt,font=\large,text height=10pt] {$\changevaltxt$} (b.north); % for addition
62
63    % equation at right end
64    \node [font=\large, anchor=west] at (\maxval+3,1.65){$\equtxt$};
65\end{tikzpicture}
66\end{document}
 1% numberline
 2\documentclass[preview,12pt]{standalone}
 3\usepackage{tikz}
 4\usetikzlibrary{positioning}
 5\usetikzlibrary {arrows.meta}
 6\usetikzlibrary{bending}
 7\usepackage{ulem}
 8\usepackage[a4paper, portrait, margin=1cm]{geometry}
 9
10\def\jumpheight{10}
11% \def\qgap{\rule[-1pt]{1.0em}{.25pt}}
12\def\qgap{\raisebox{-1pt}{\dotuline{\phantom{X}}}}
13
14% modify values for number lines
15\def\minval{-10}
16\def\midval{0}
17\def\maxval{10}
18% modify values for number lines
19\def\startval{-3}
20\def\endval{2}
21% values for display
22\def\startvaltxt{\startval}
23\def\endvaltxt{\endval}
24\def\changevaltxt{\the\numexpr\endval-\startval\relax} % Automatically computes the change
25\def\equtxt{\the\numexpr\startval\relax + \the\numexpr\changevaltxt\relax = \the\numexpr\endval\relax} % Computes full equation
26% end modify values for number lines
27
28\begin{document}
29\begin{tikzpicture}[scale=0.67]
30    % axis, arrow style to-to
31    \draw[{To[scale=1.3]}-{To[scale=1.3]}, line width=1pt] (\minval-0.4, 0) -- (\maxval+0.4, 0);
32
33    % % tick marks
34    \pgfmathtruncatemacro{\nextmin}{\minval+1}
35    \foreach \x in {\minval,\nextmin,...,\maxval}
36        \draw[shift={(\x,0)},color=black, line width=1pt] (0pt,-14pt) -- (0pt,0pt);
37
38
39    % % numbers along each axis
40    \foreach \x in {\minval,\midval,\maxval} {
41        \pgfmathtruncatemacro\result{\x<0} % Converts boolean to 1 or 0
42        \ifnum\result=1
43            \draw[shift={(\x-0.3,-0.8)},color=black] node[font=\large,text height=12pt] {$\x$};
44        \else
45            \draw[shift={(\x,-0.8)},color=black] node[font=\large,text height=12pt] {$\x$};
46        \fi
47    }
48
49    % Start and end value labels
50    \draw[shift={(\startval,-0.8)},color=black] node[font=\large,text height=12pt] {$\startvaltxt$};
51    \draw[shift={(\endval,-0.8)},color=black] node[font=\large,text height=12pt] {$\endvaltxt$};
52
53    % dots
54    \filldraw[black] (\startval,0) circle (4pt) node[above,yshift=-2pt] (a) {};
55    \filldraw[black] (\endval,0) circle (4pt) node[above,yshift=-2pt] (b) {};
56
57    % arrow
58    \draw[-{To[scale=1.3, bend]},line width=1pt, color=black] (a.north)
59        .. controls  +(north:\jumpheight mm) and +(north:\jumpheight mm) ..
60        node[above=2pt,xshift=-6pt,font=\large,text height=10pt] {$\changevaltxt$} (b.north); % for addition
61
62    % equation at right end
63    \node [font=\large, anchor=west] at (\maxval+3,1.65){$\equtxt$};
64\end{tikzpicture}
65\end{document}